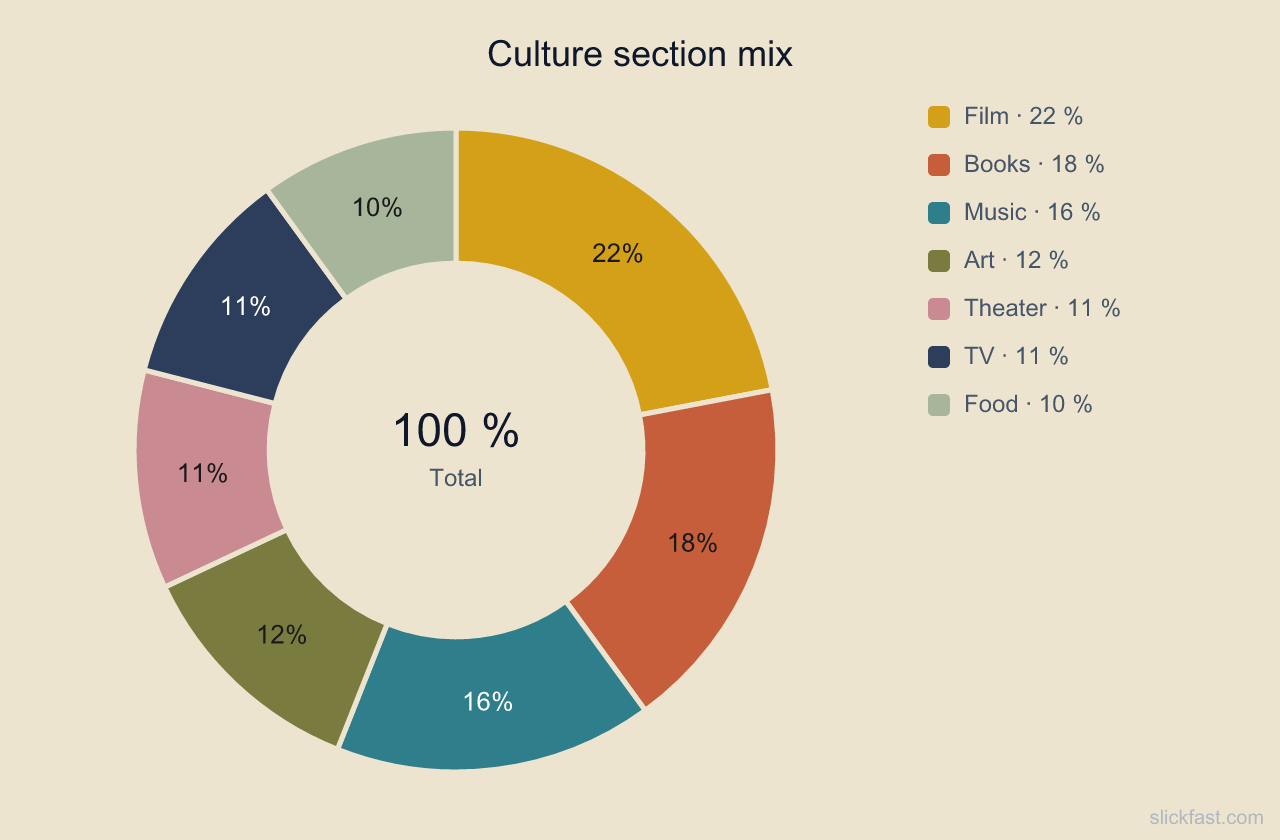
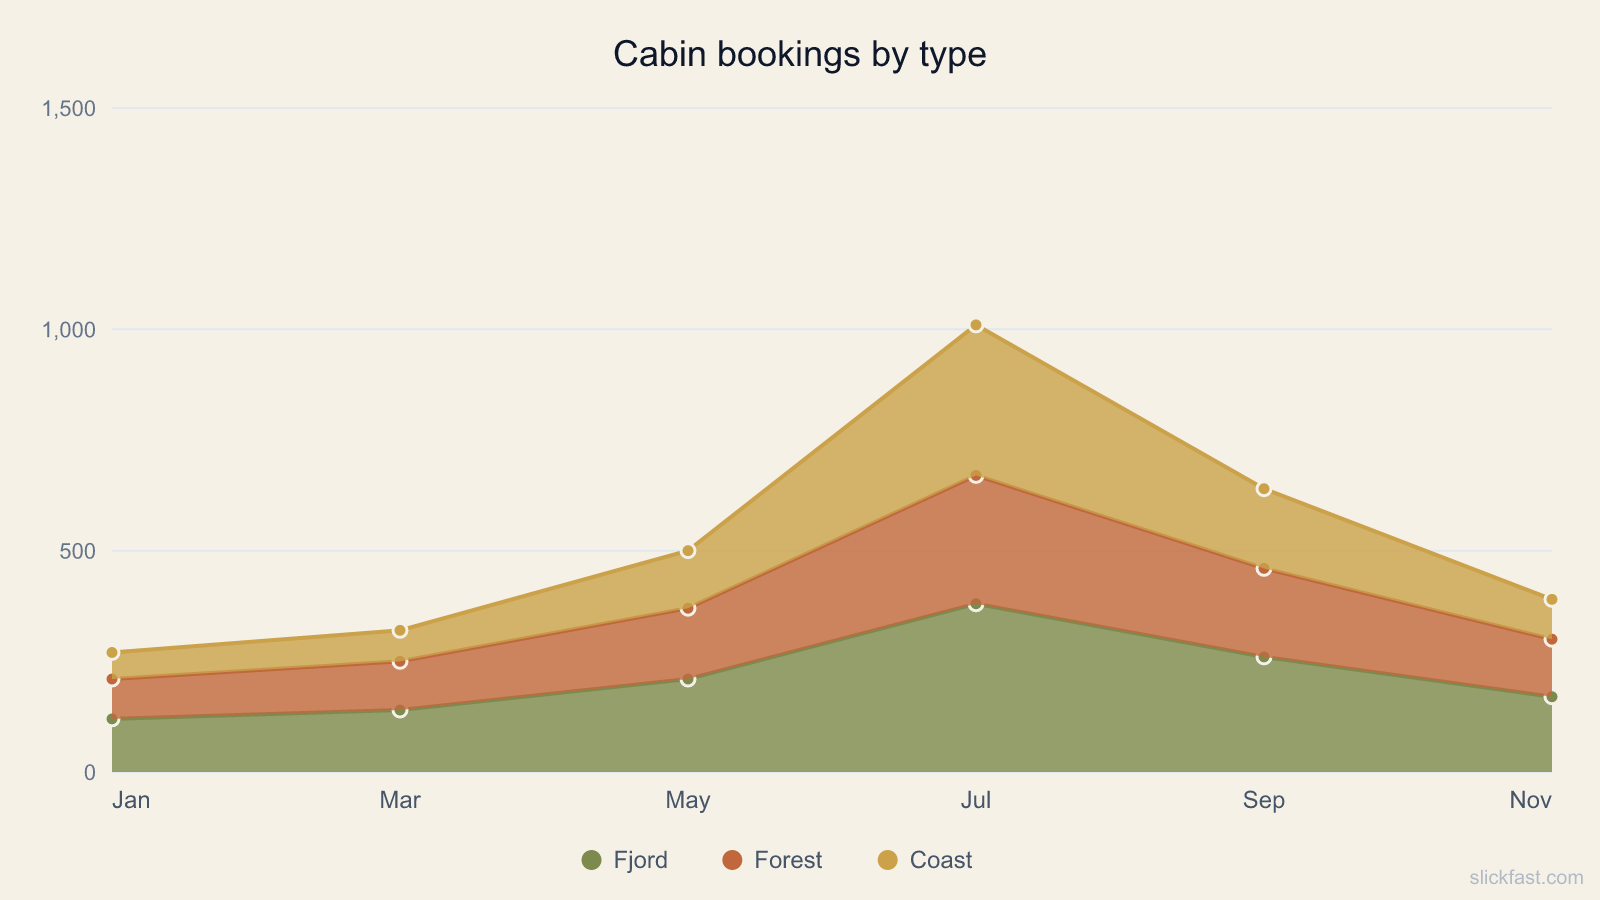
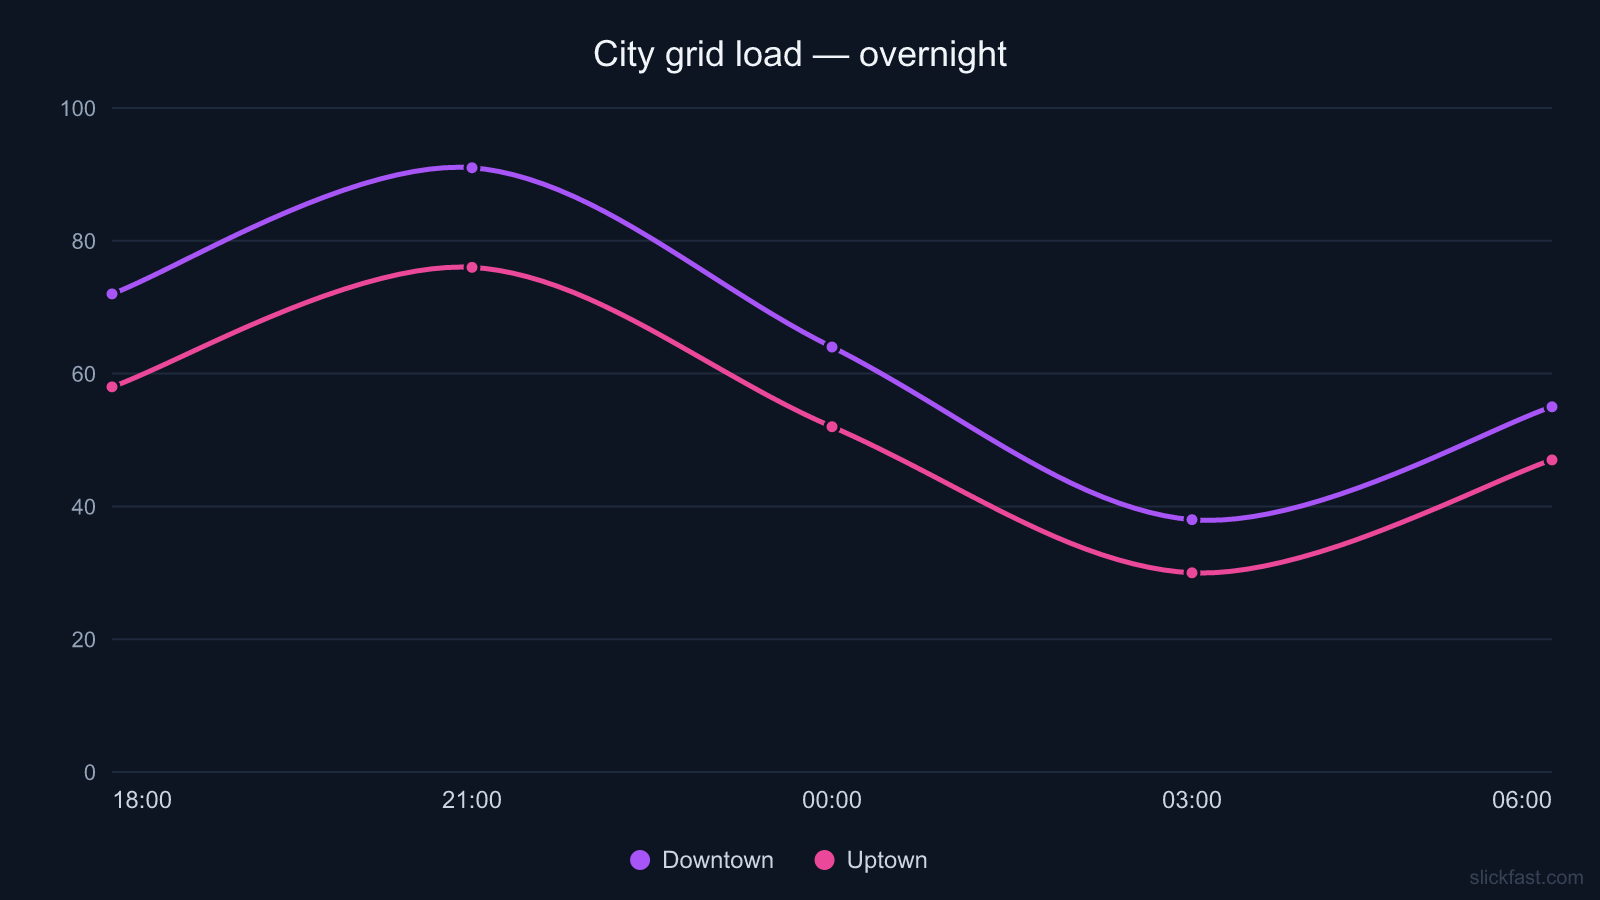
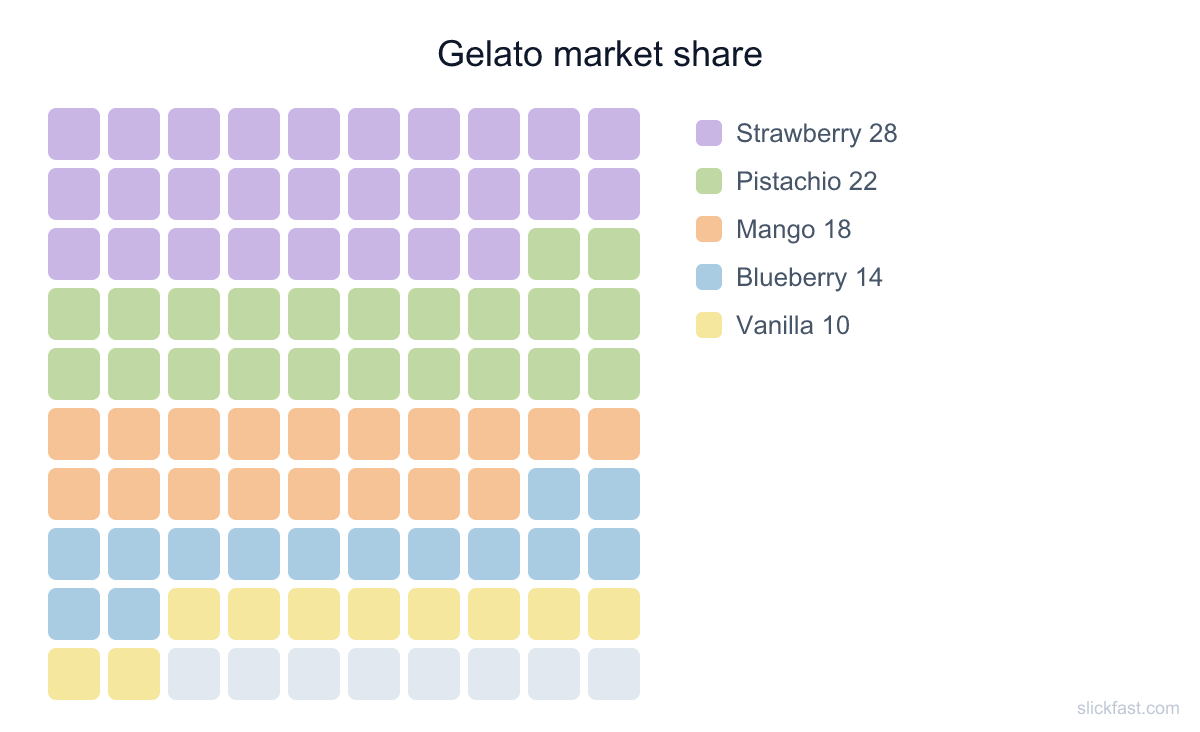
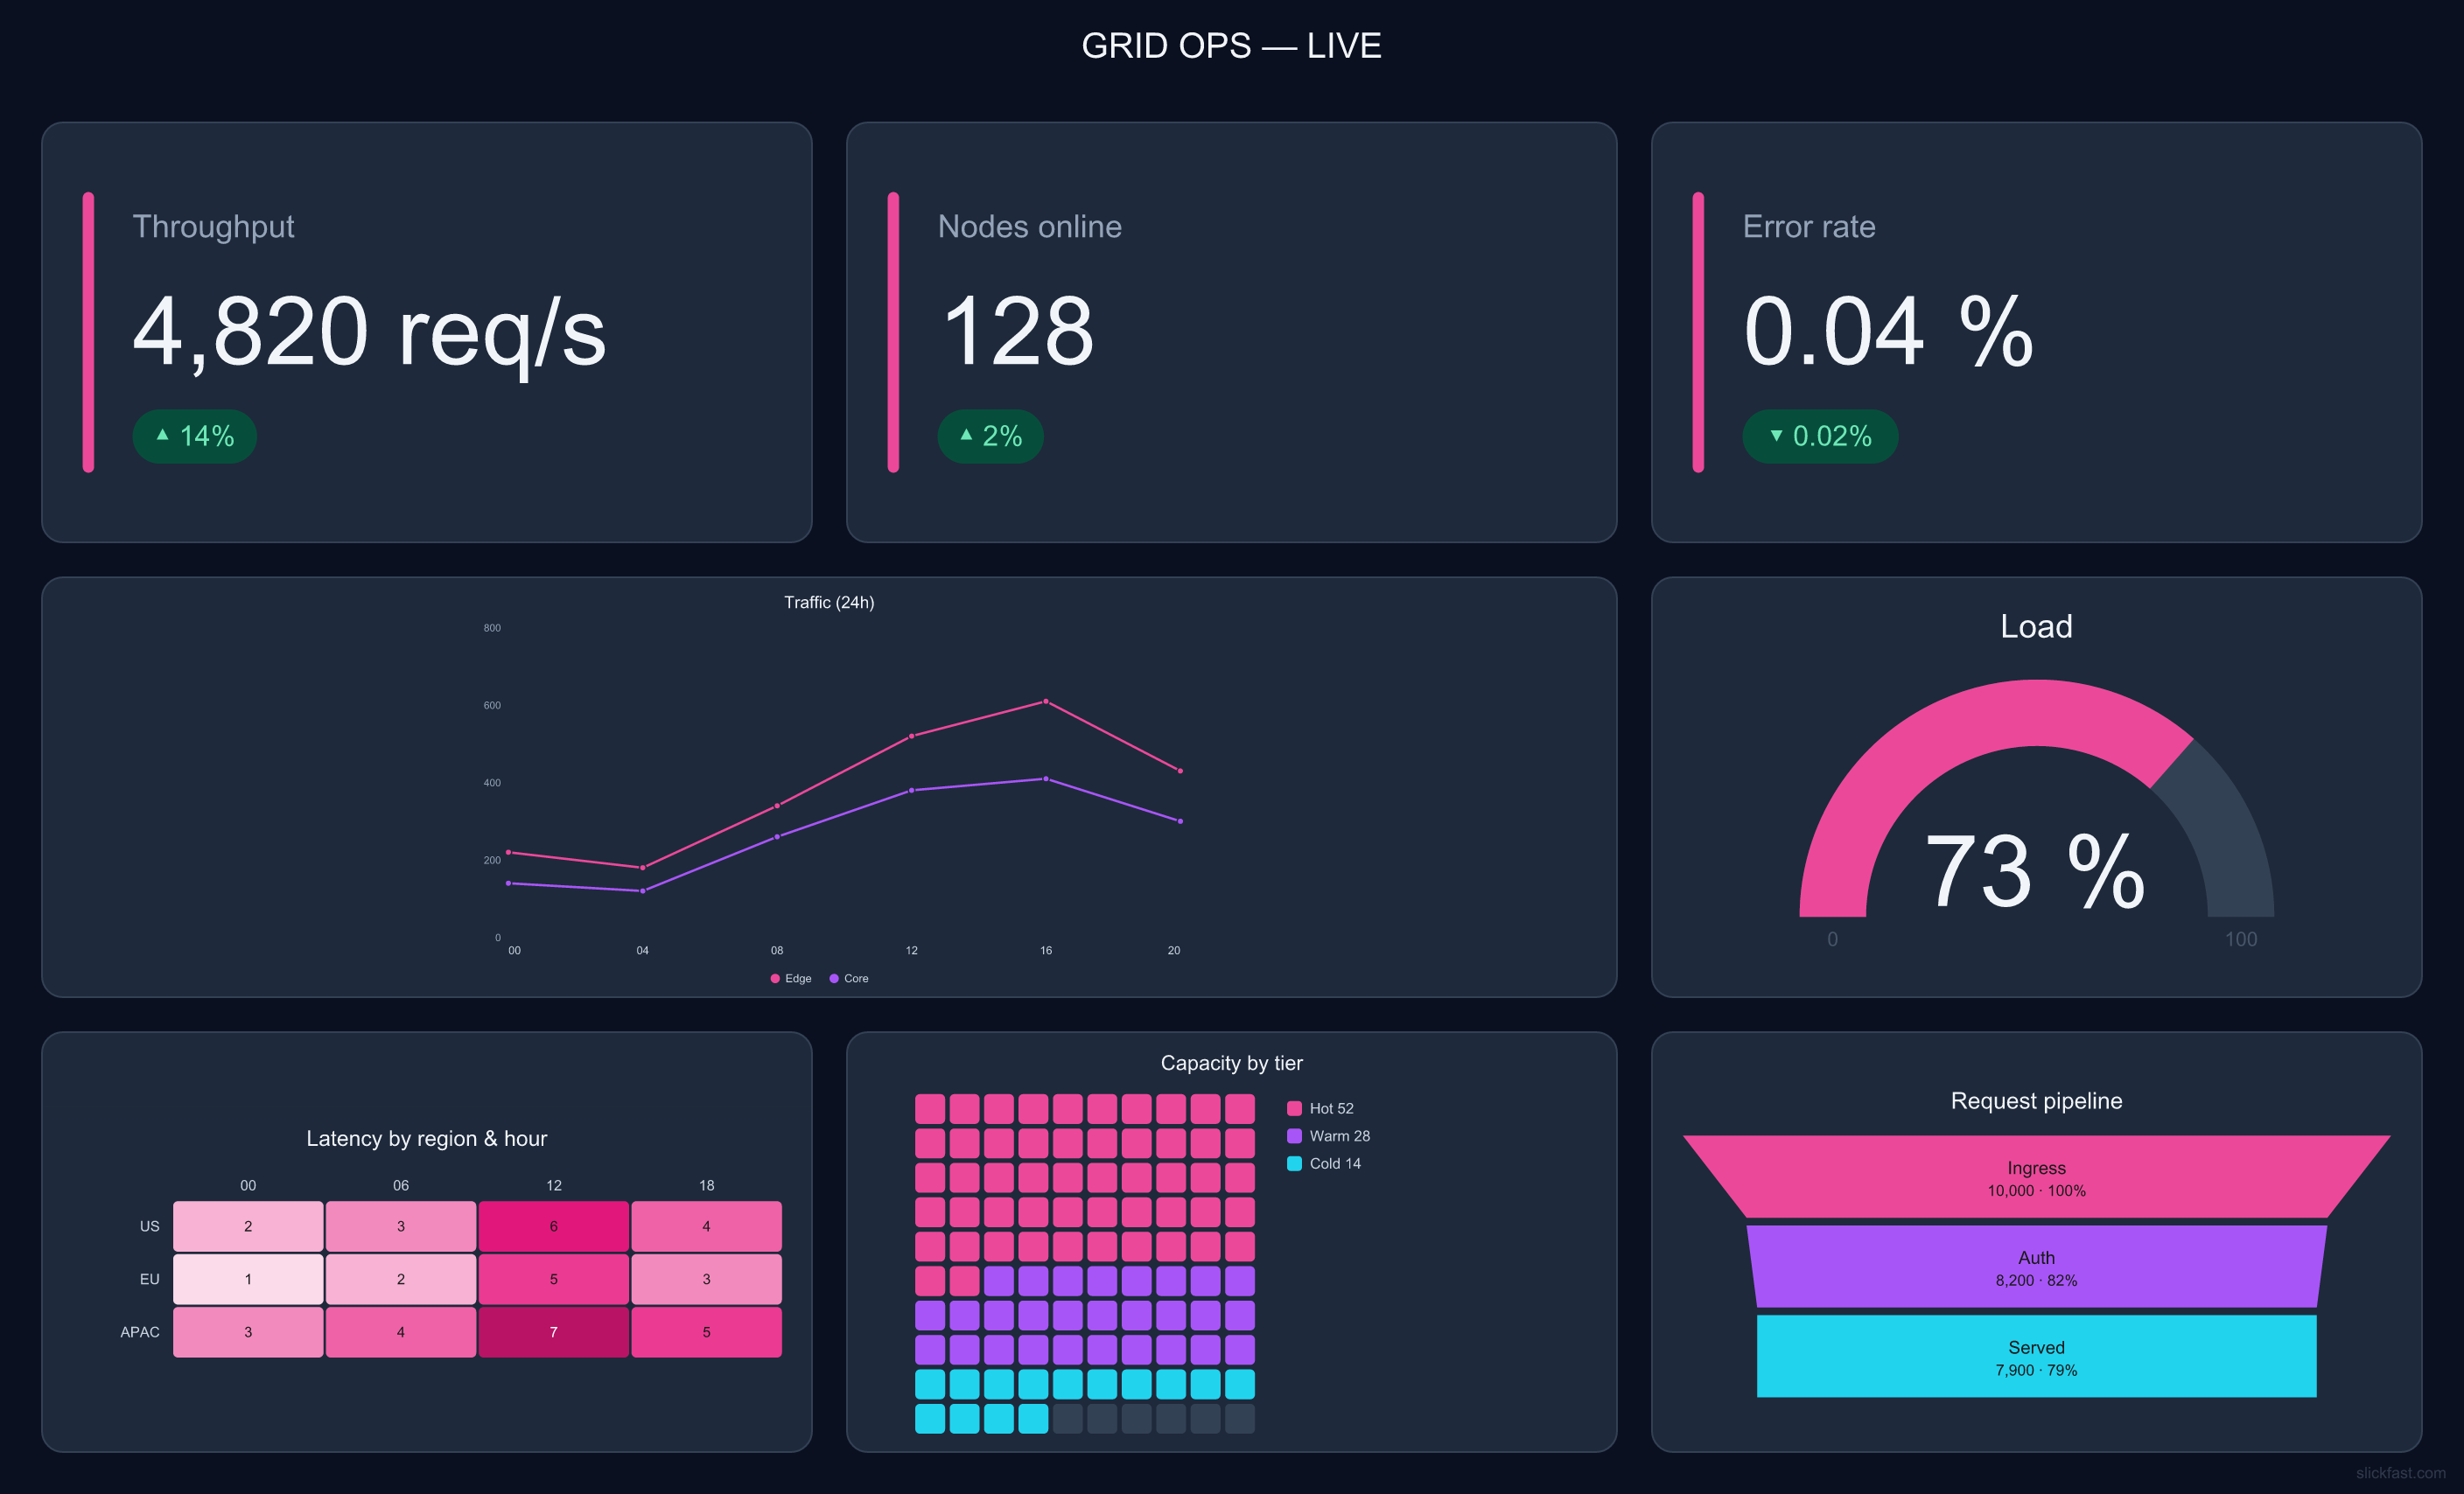
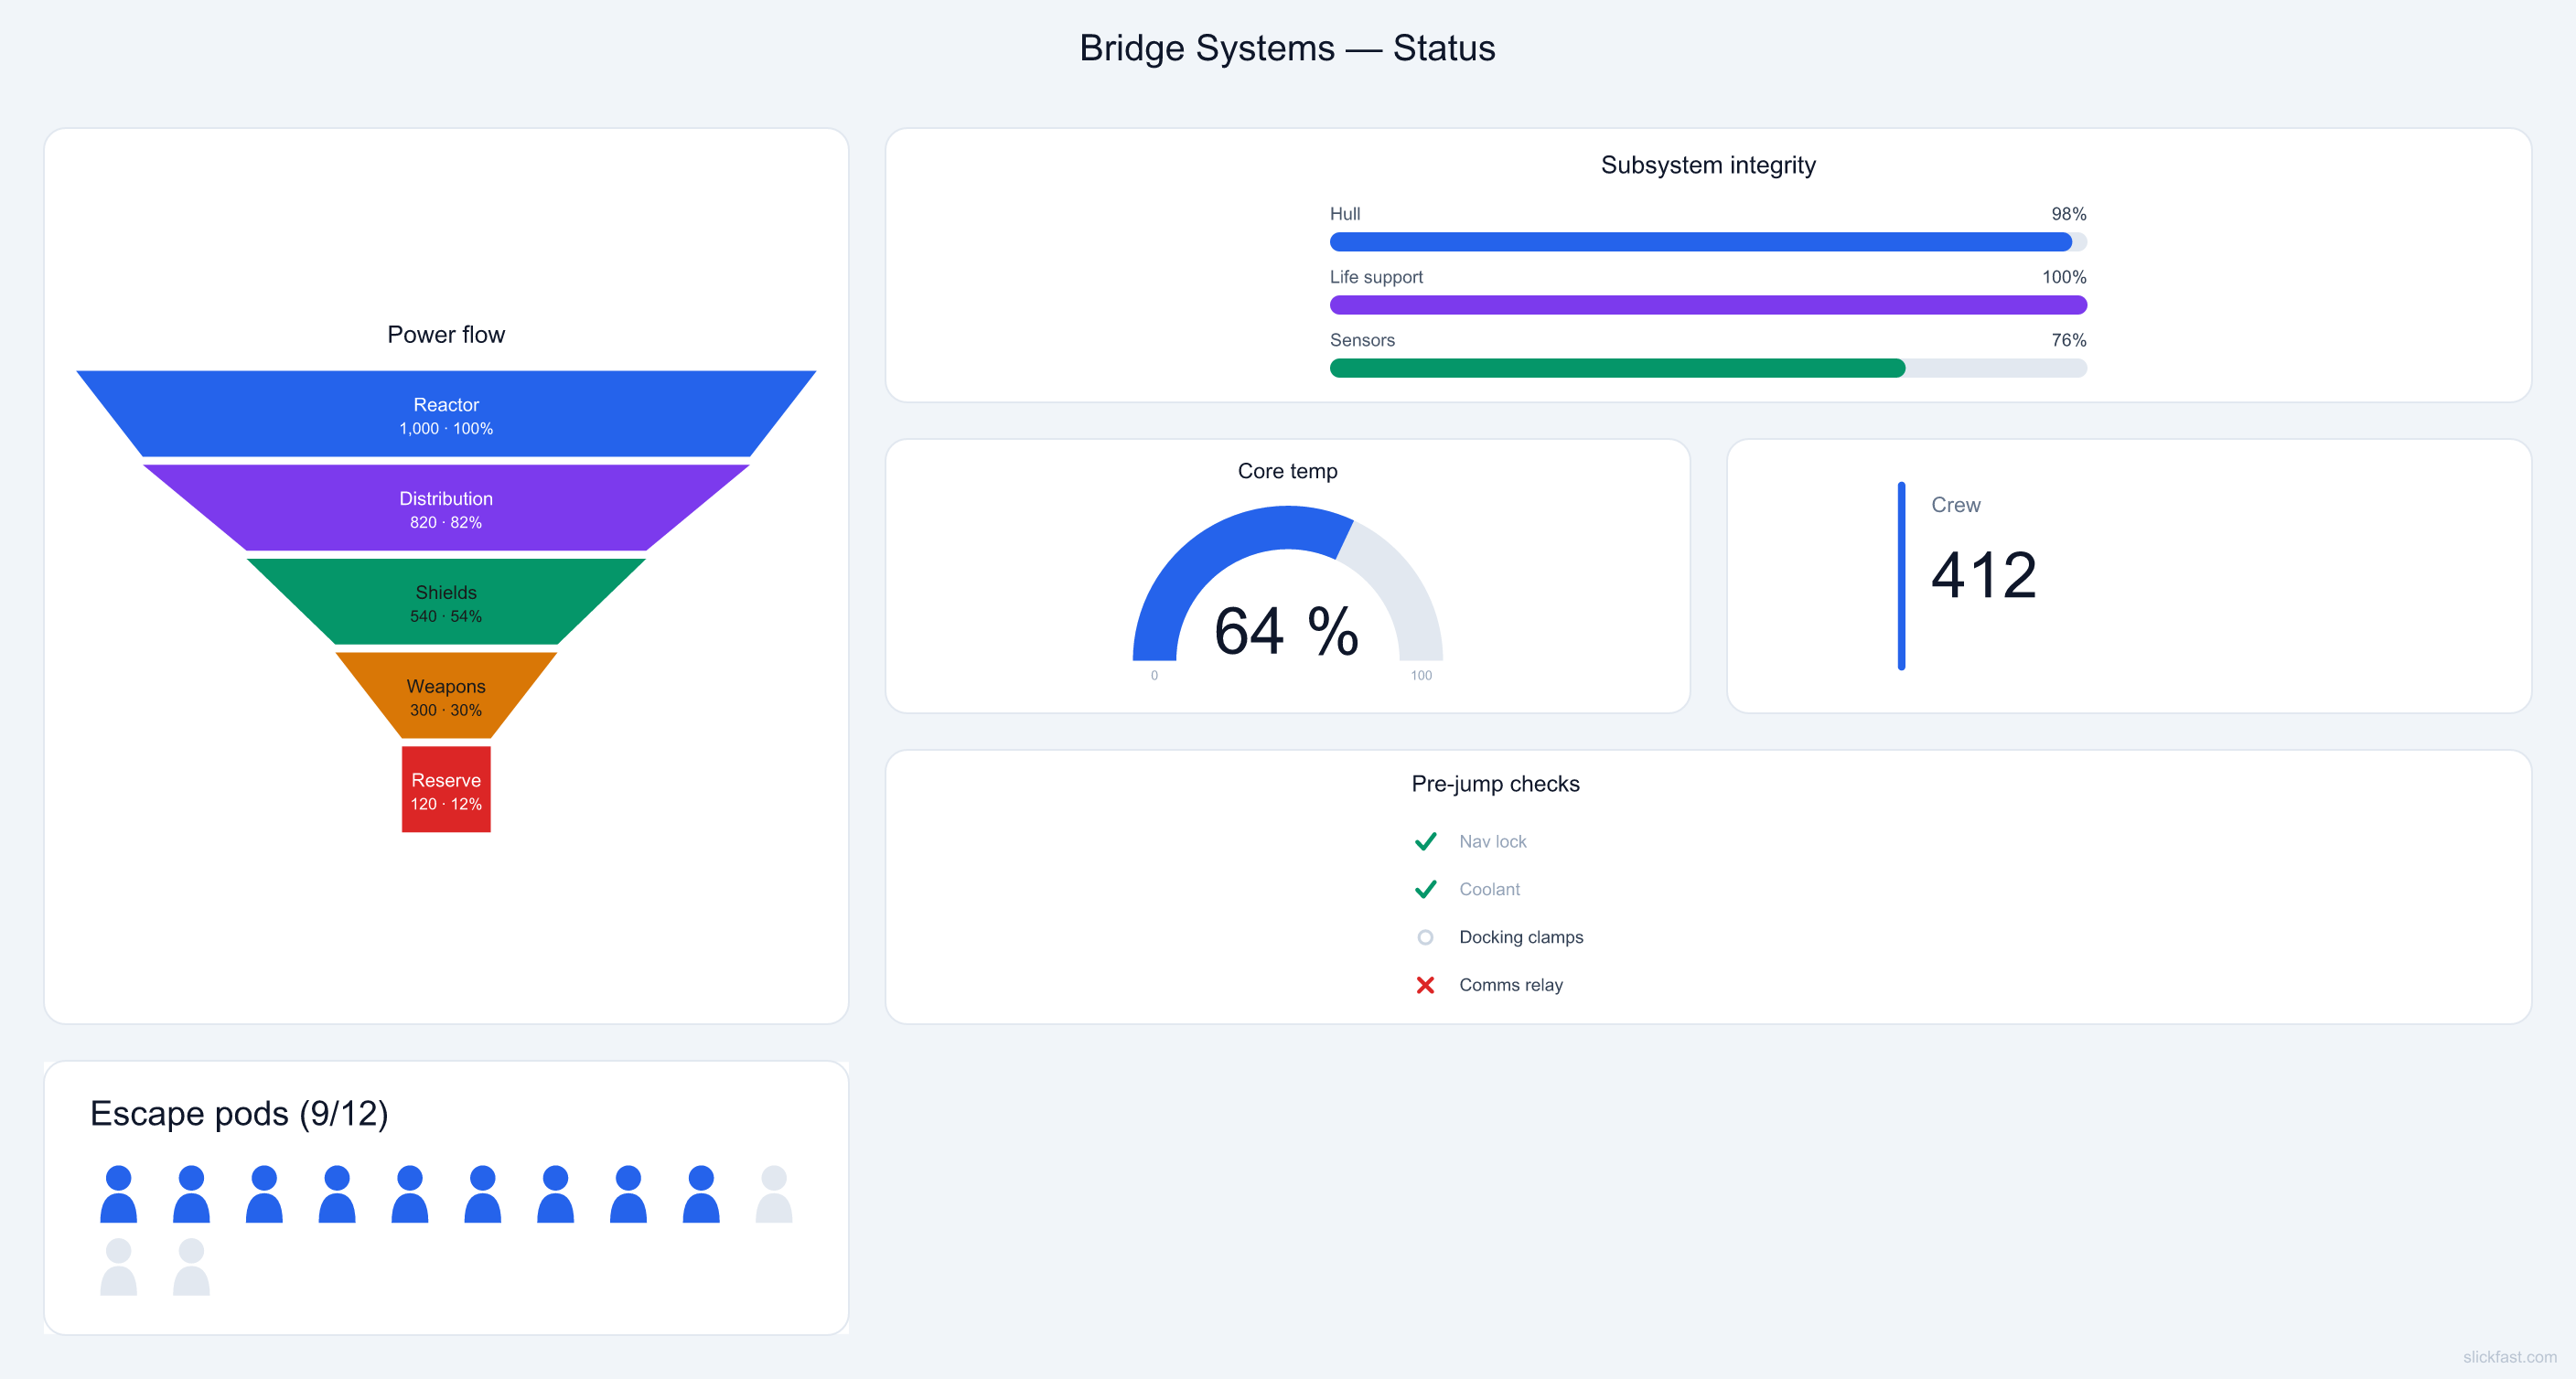
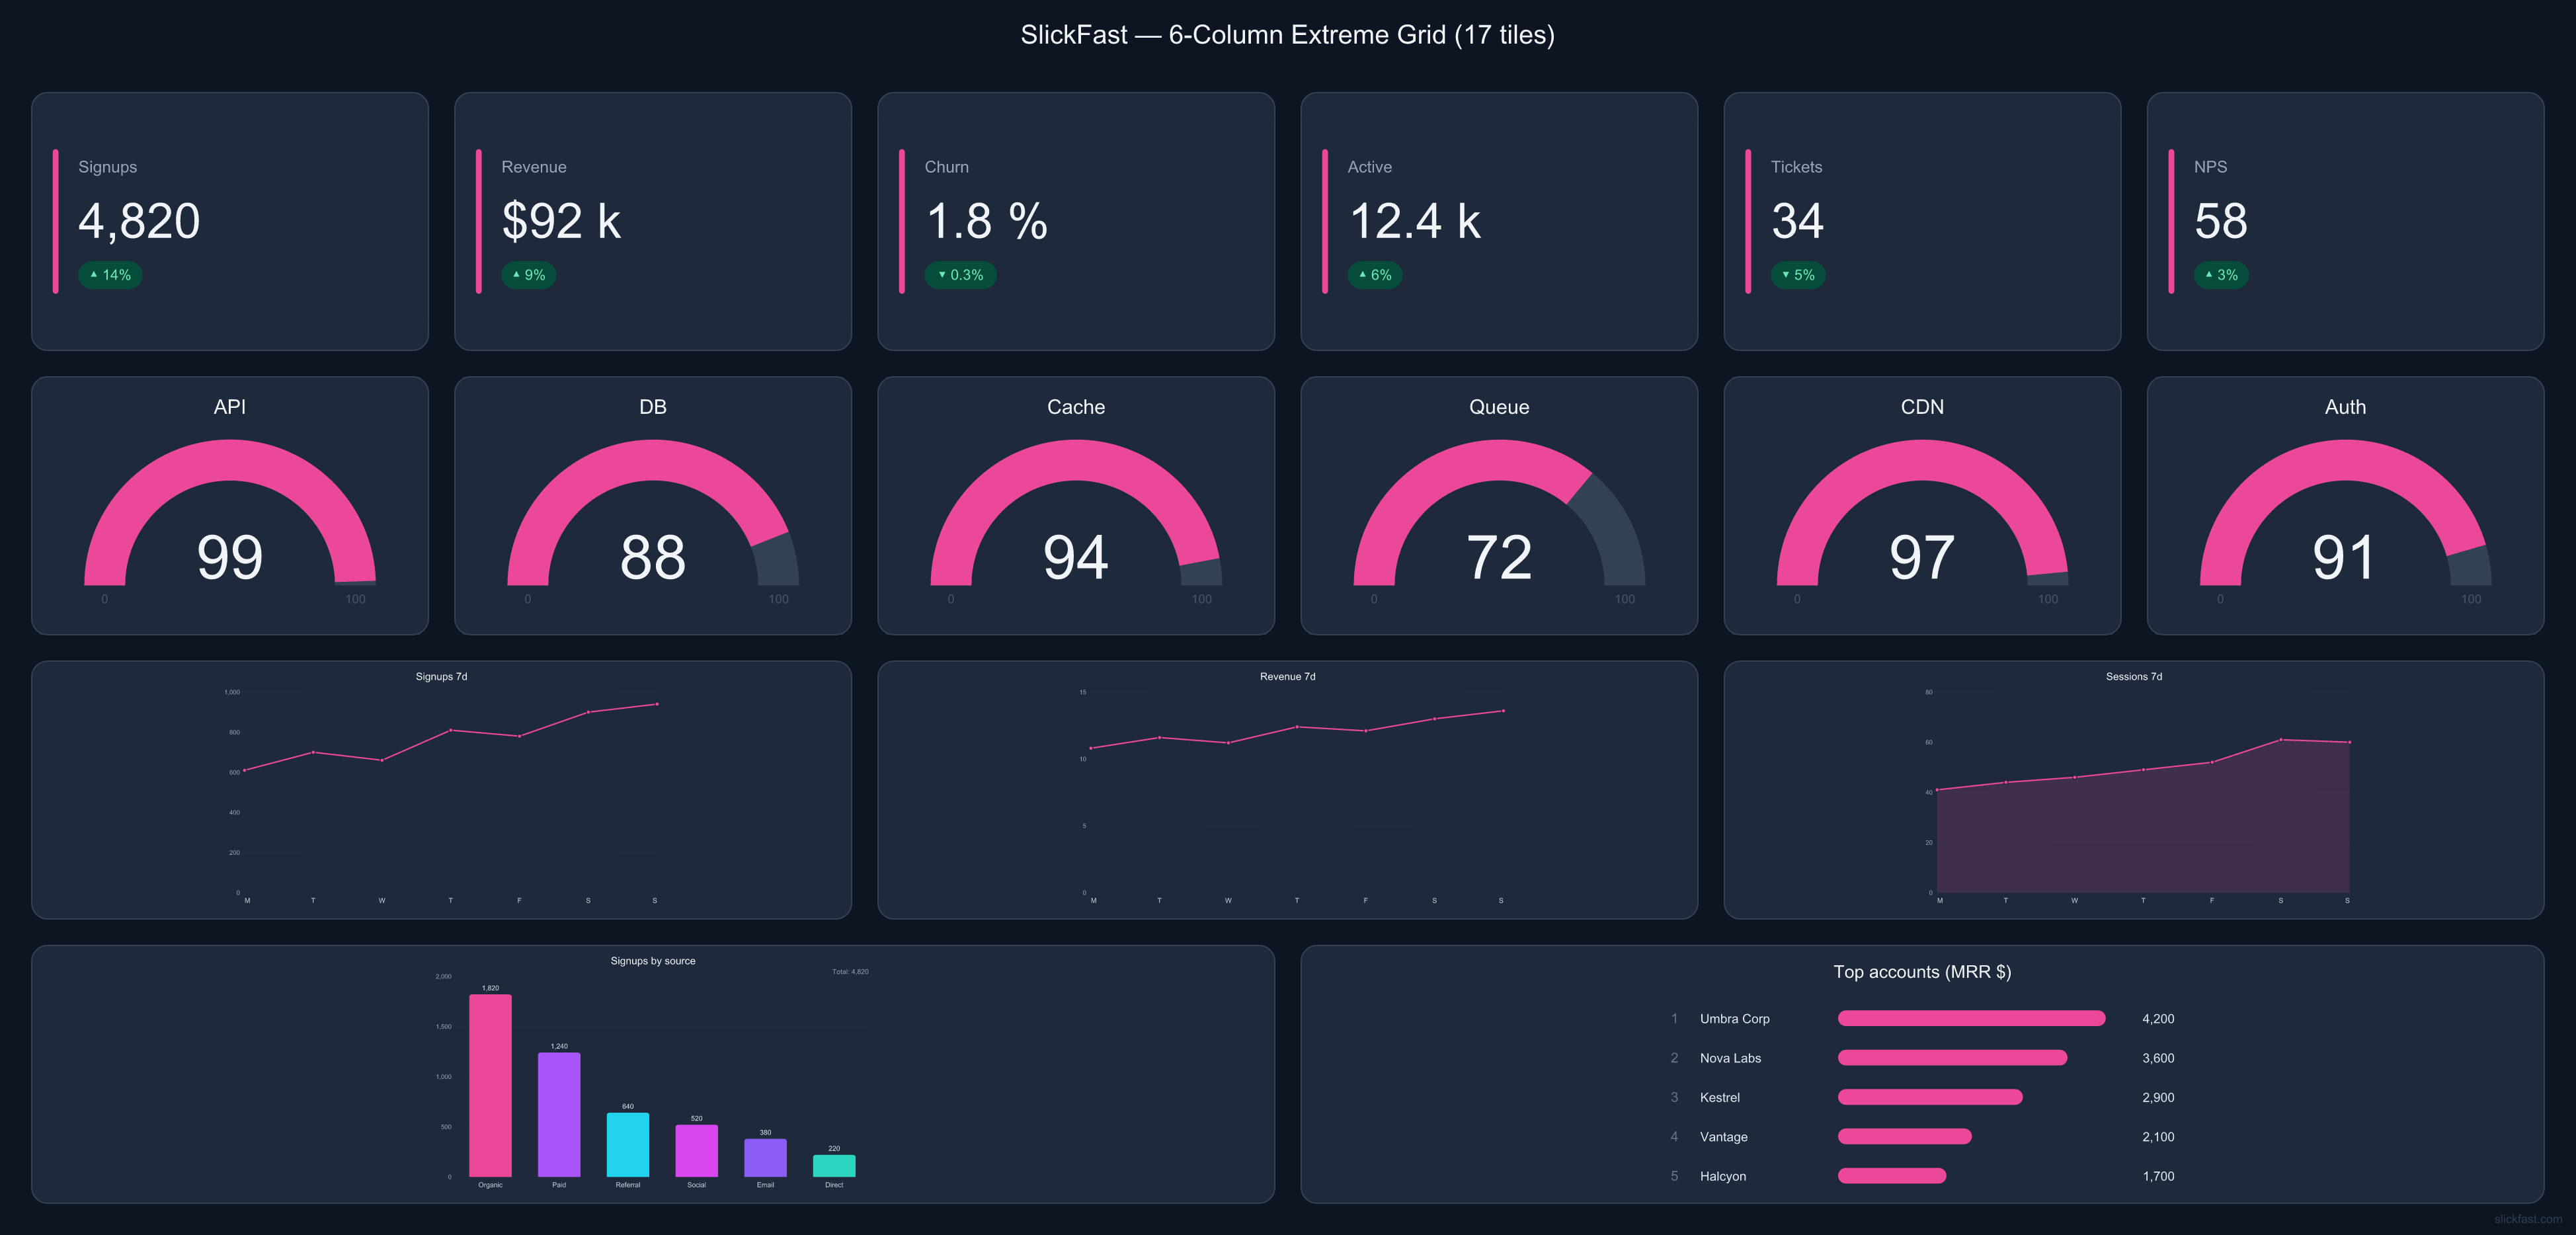
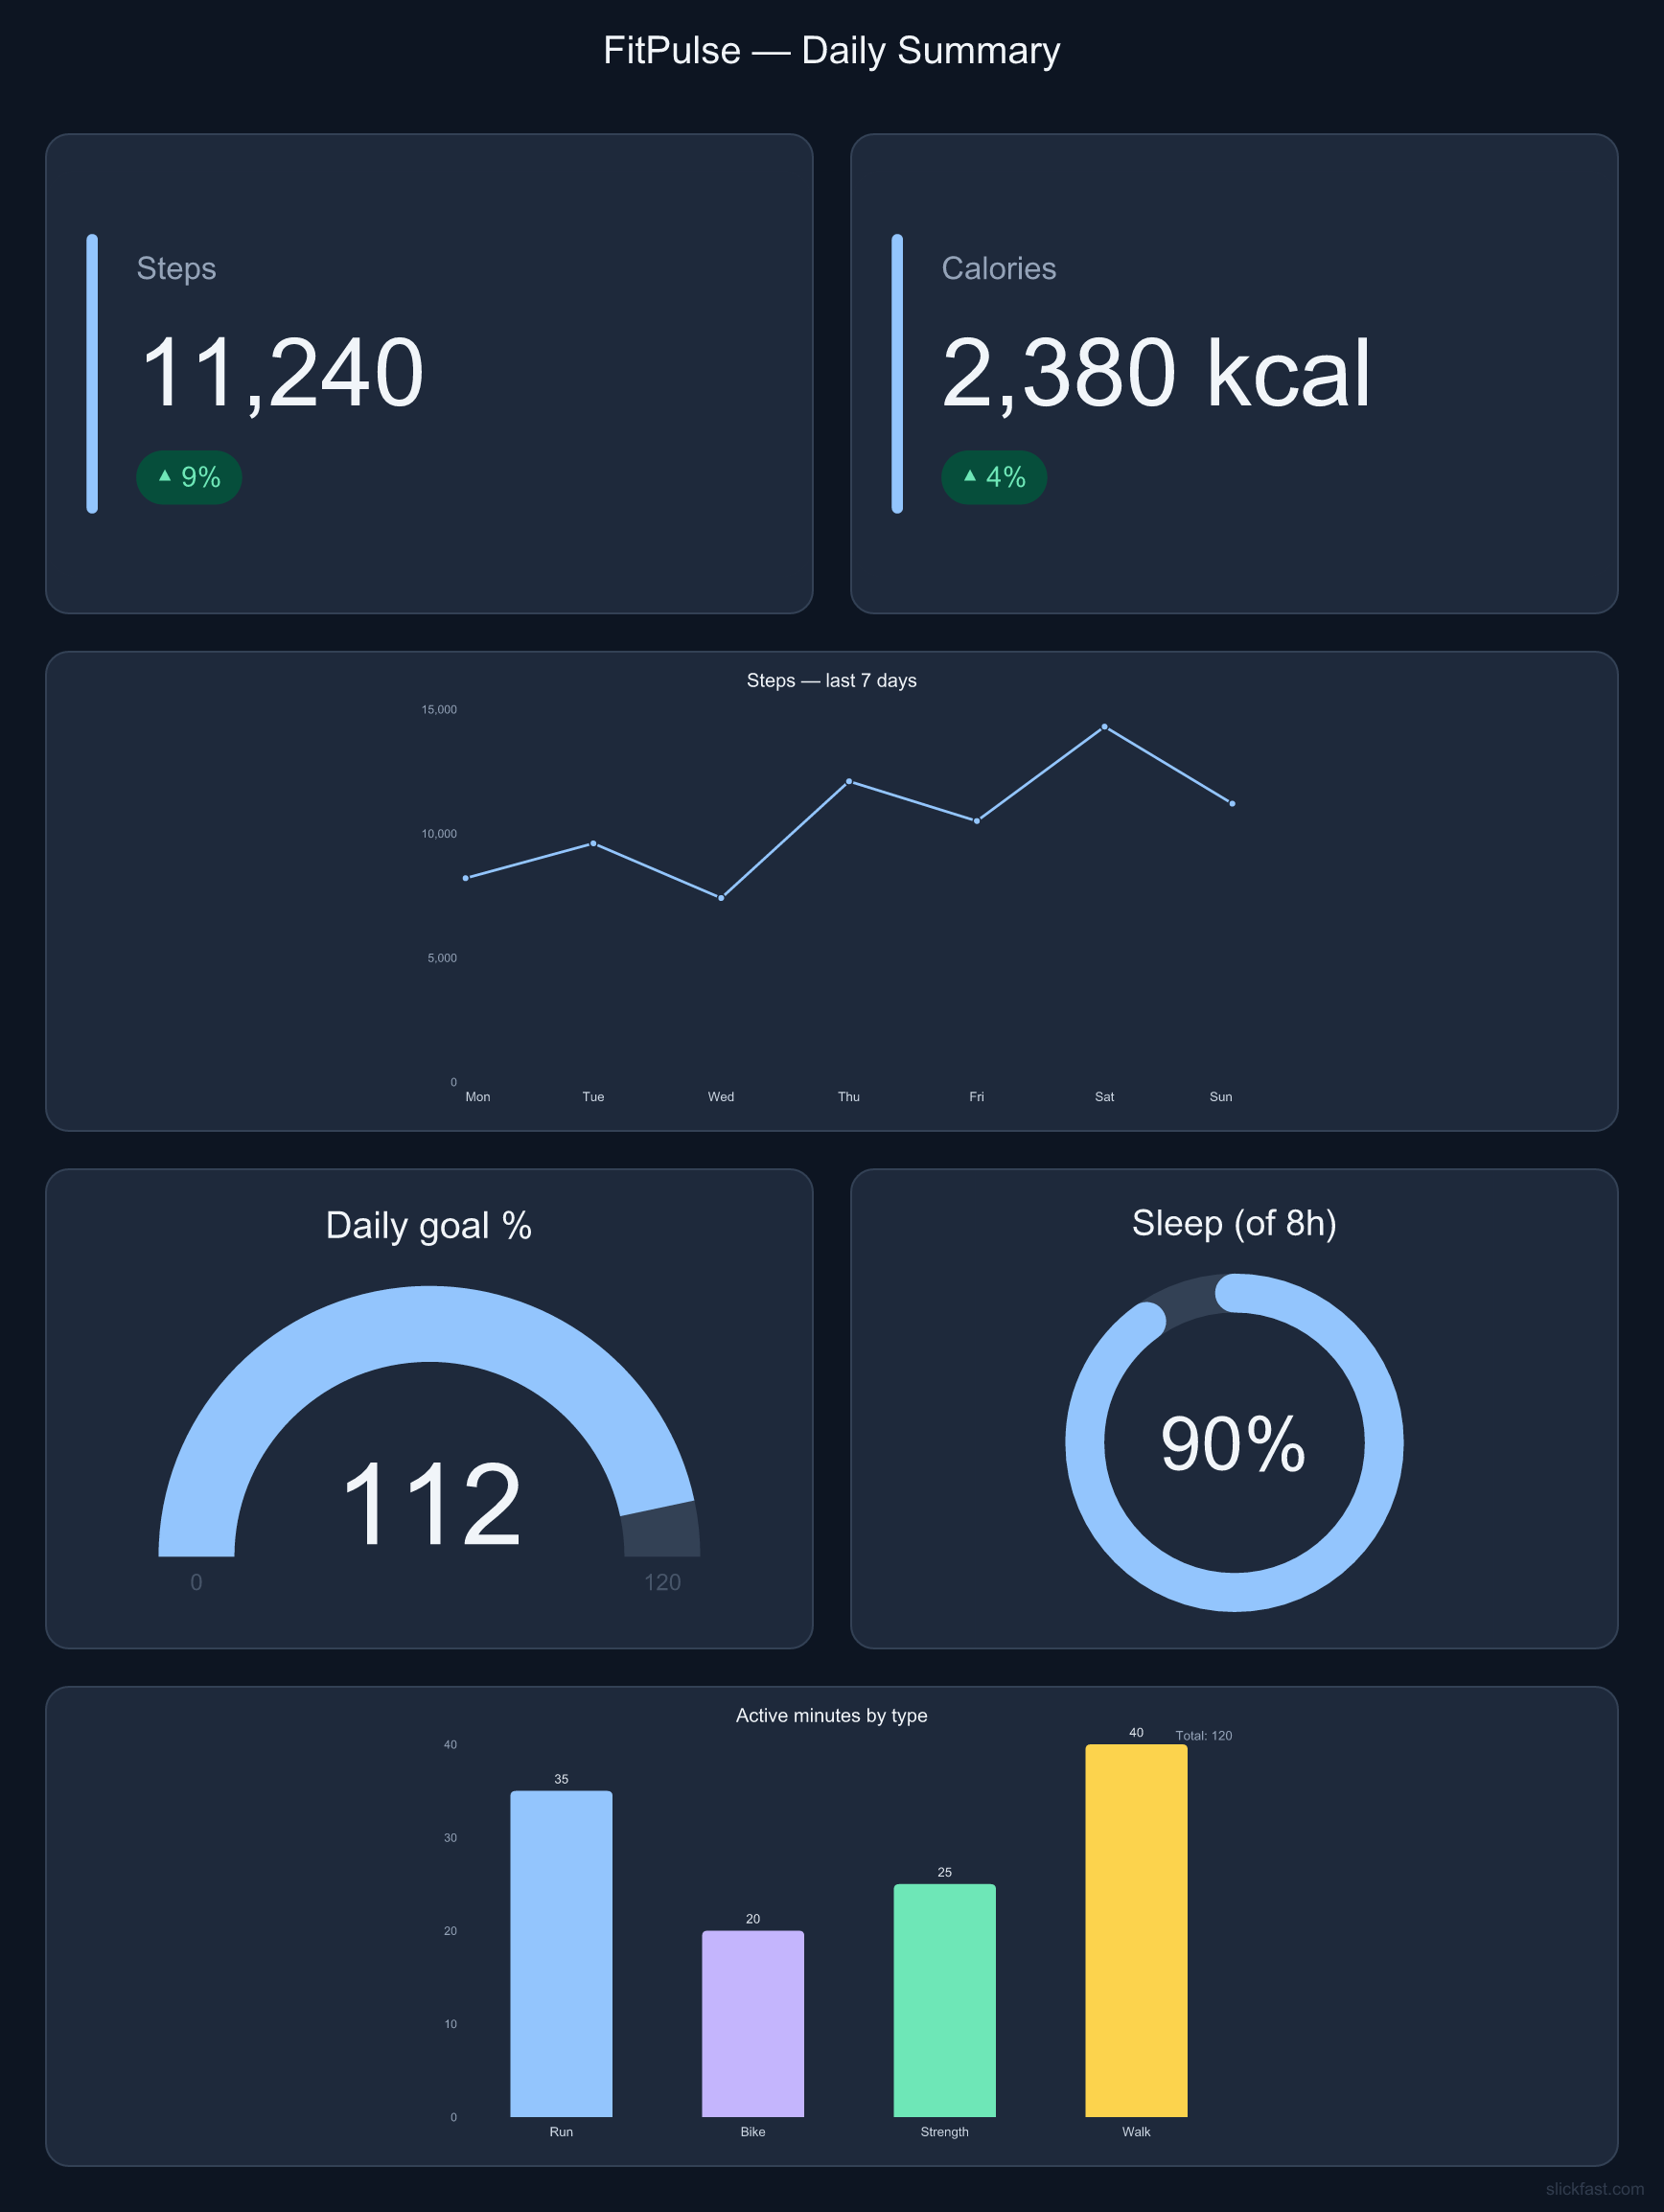
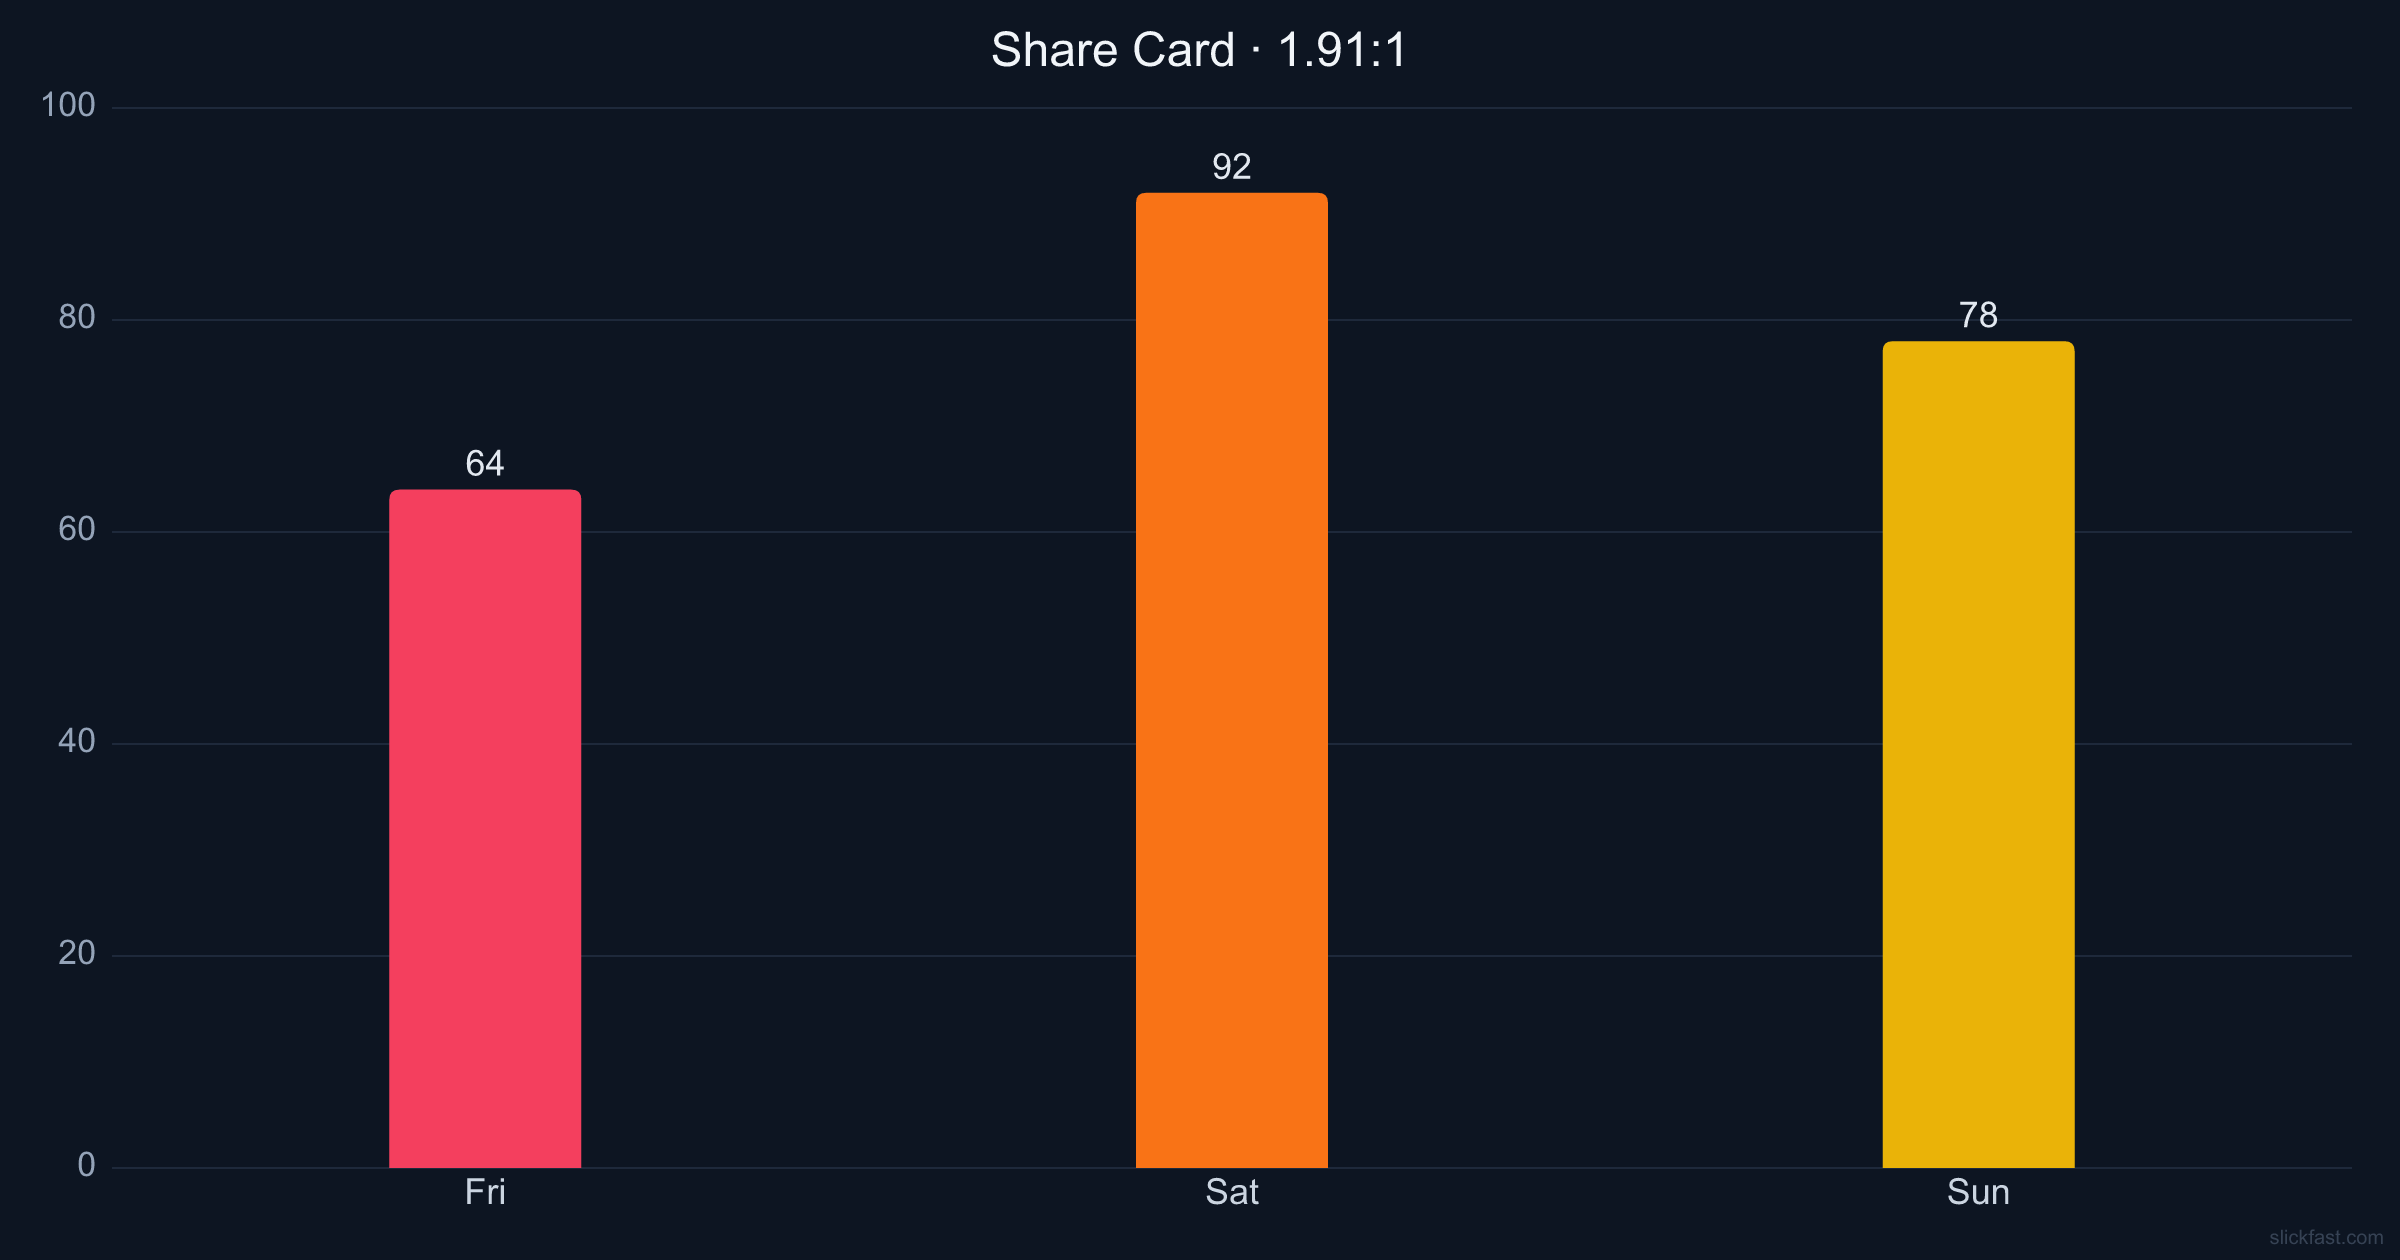
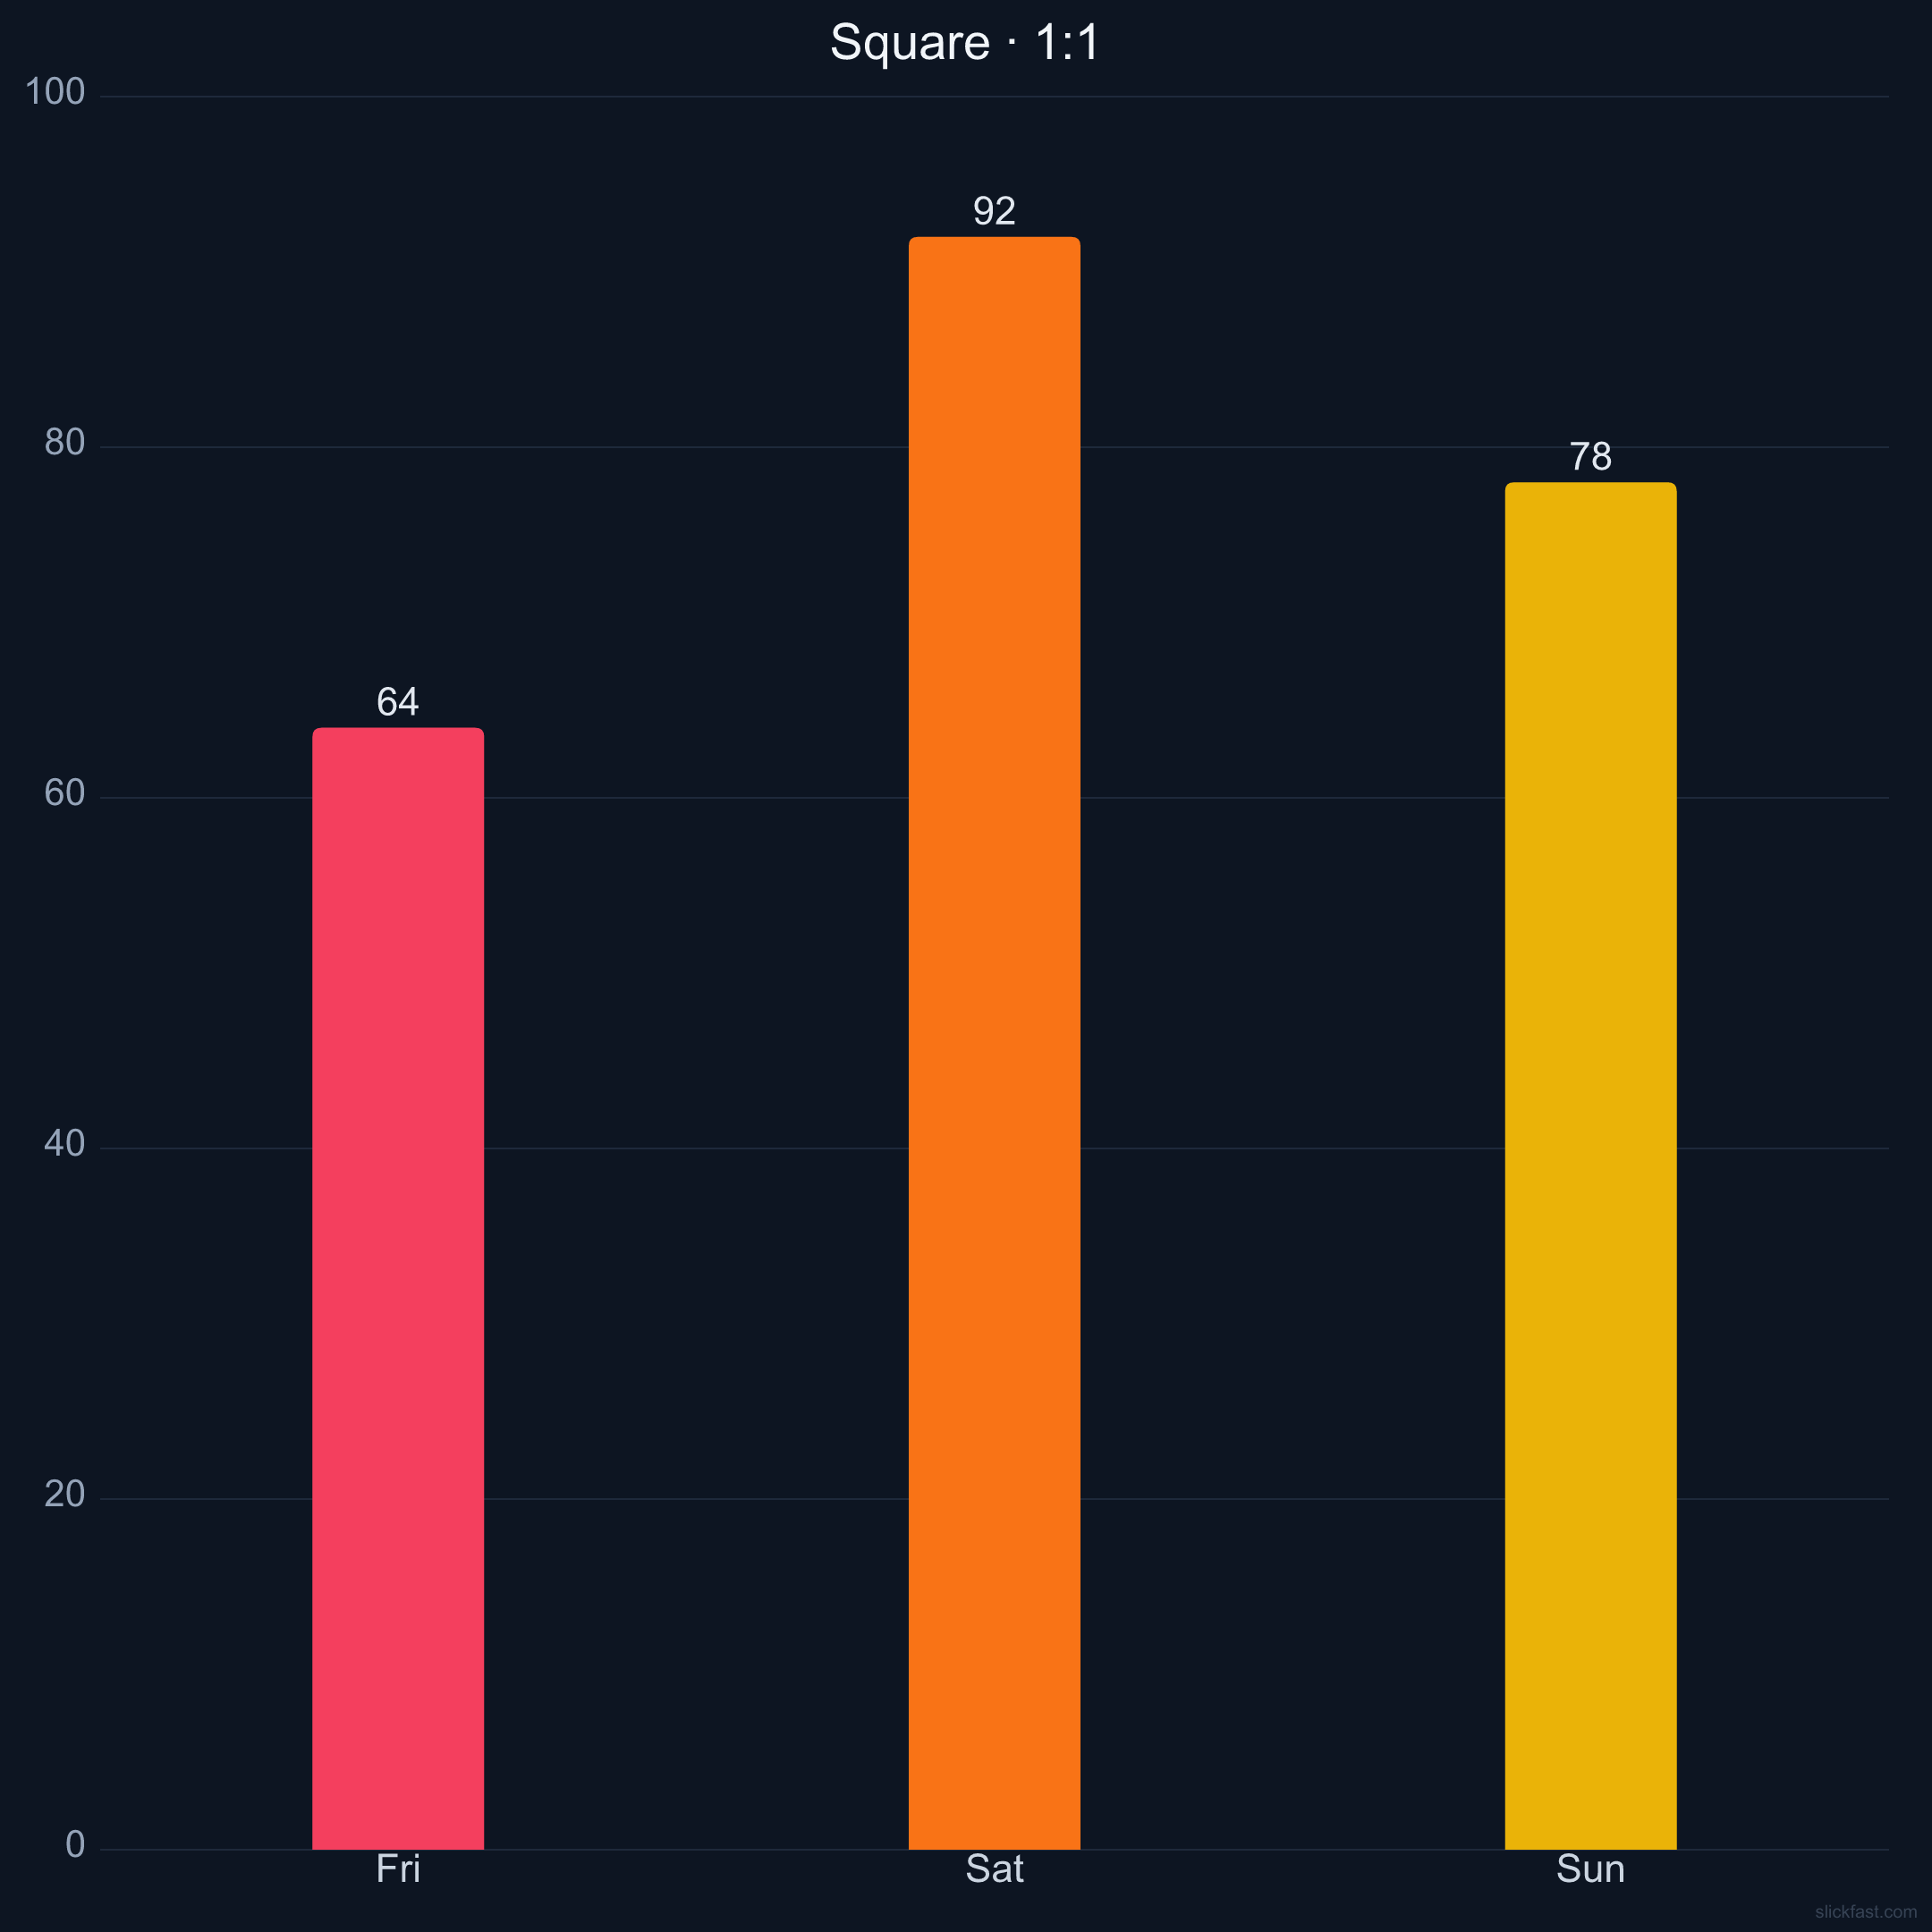
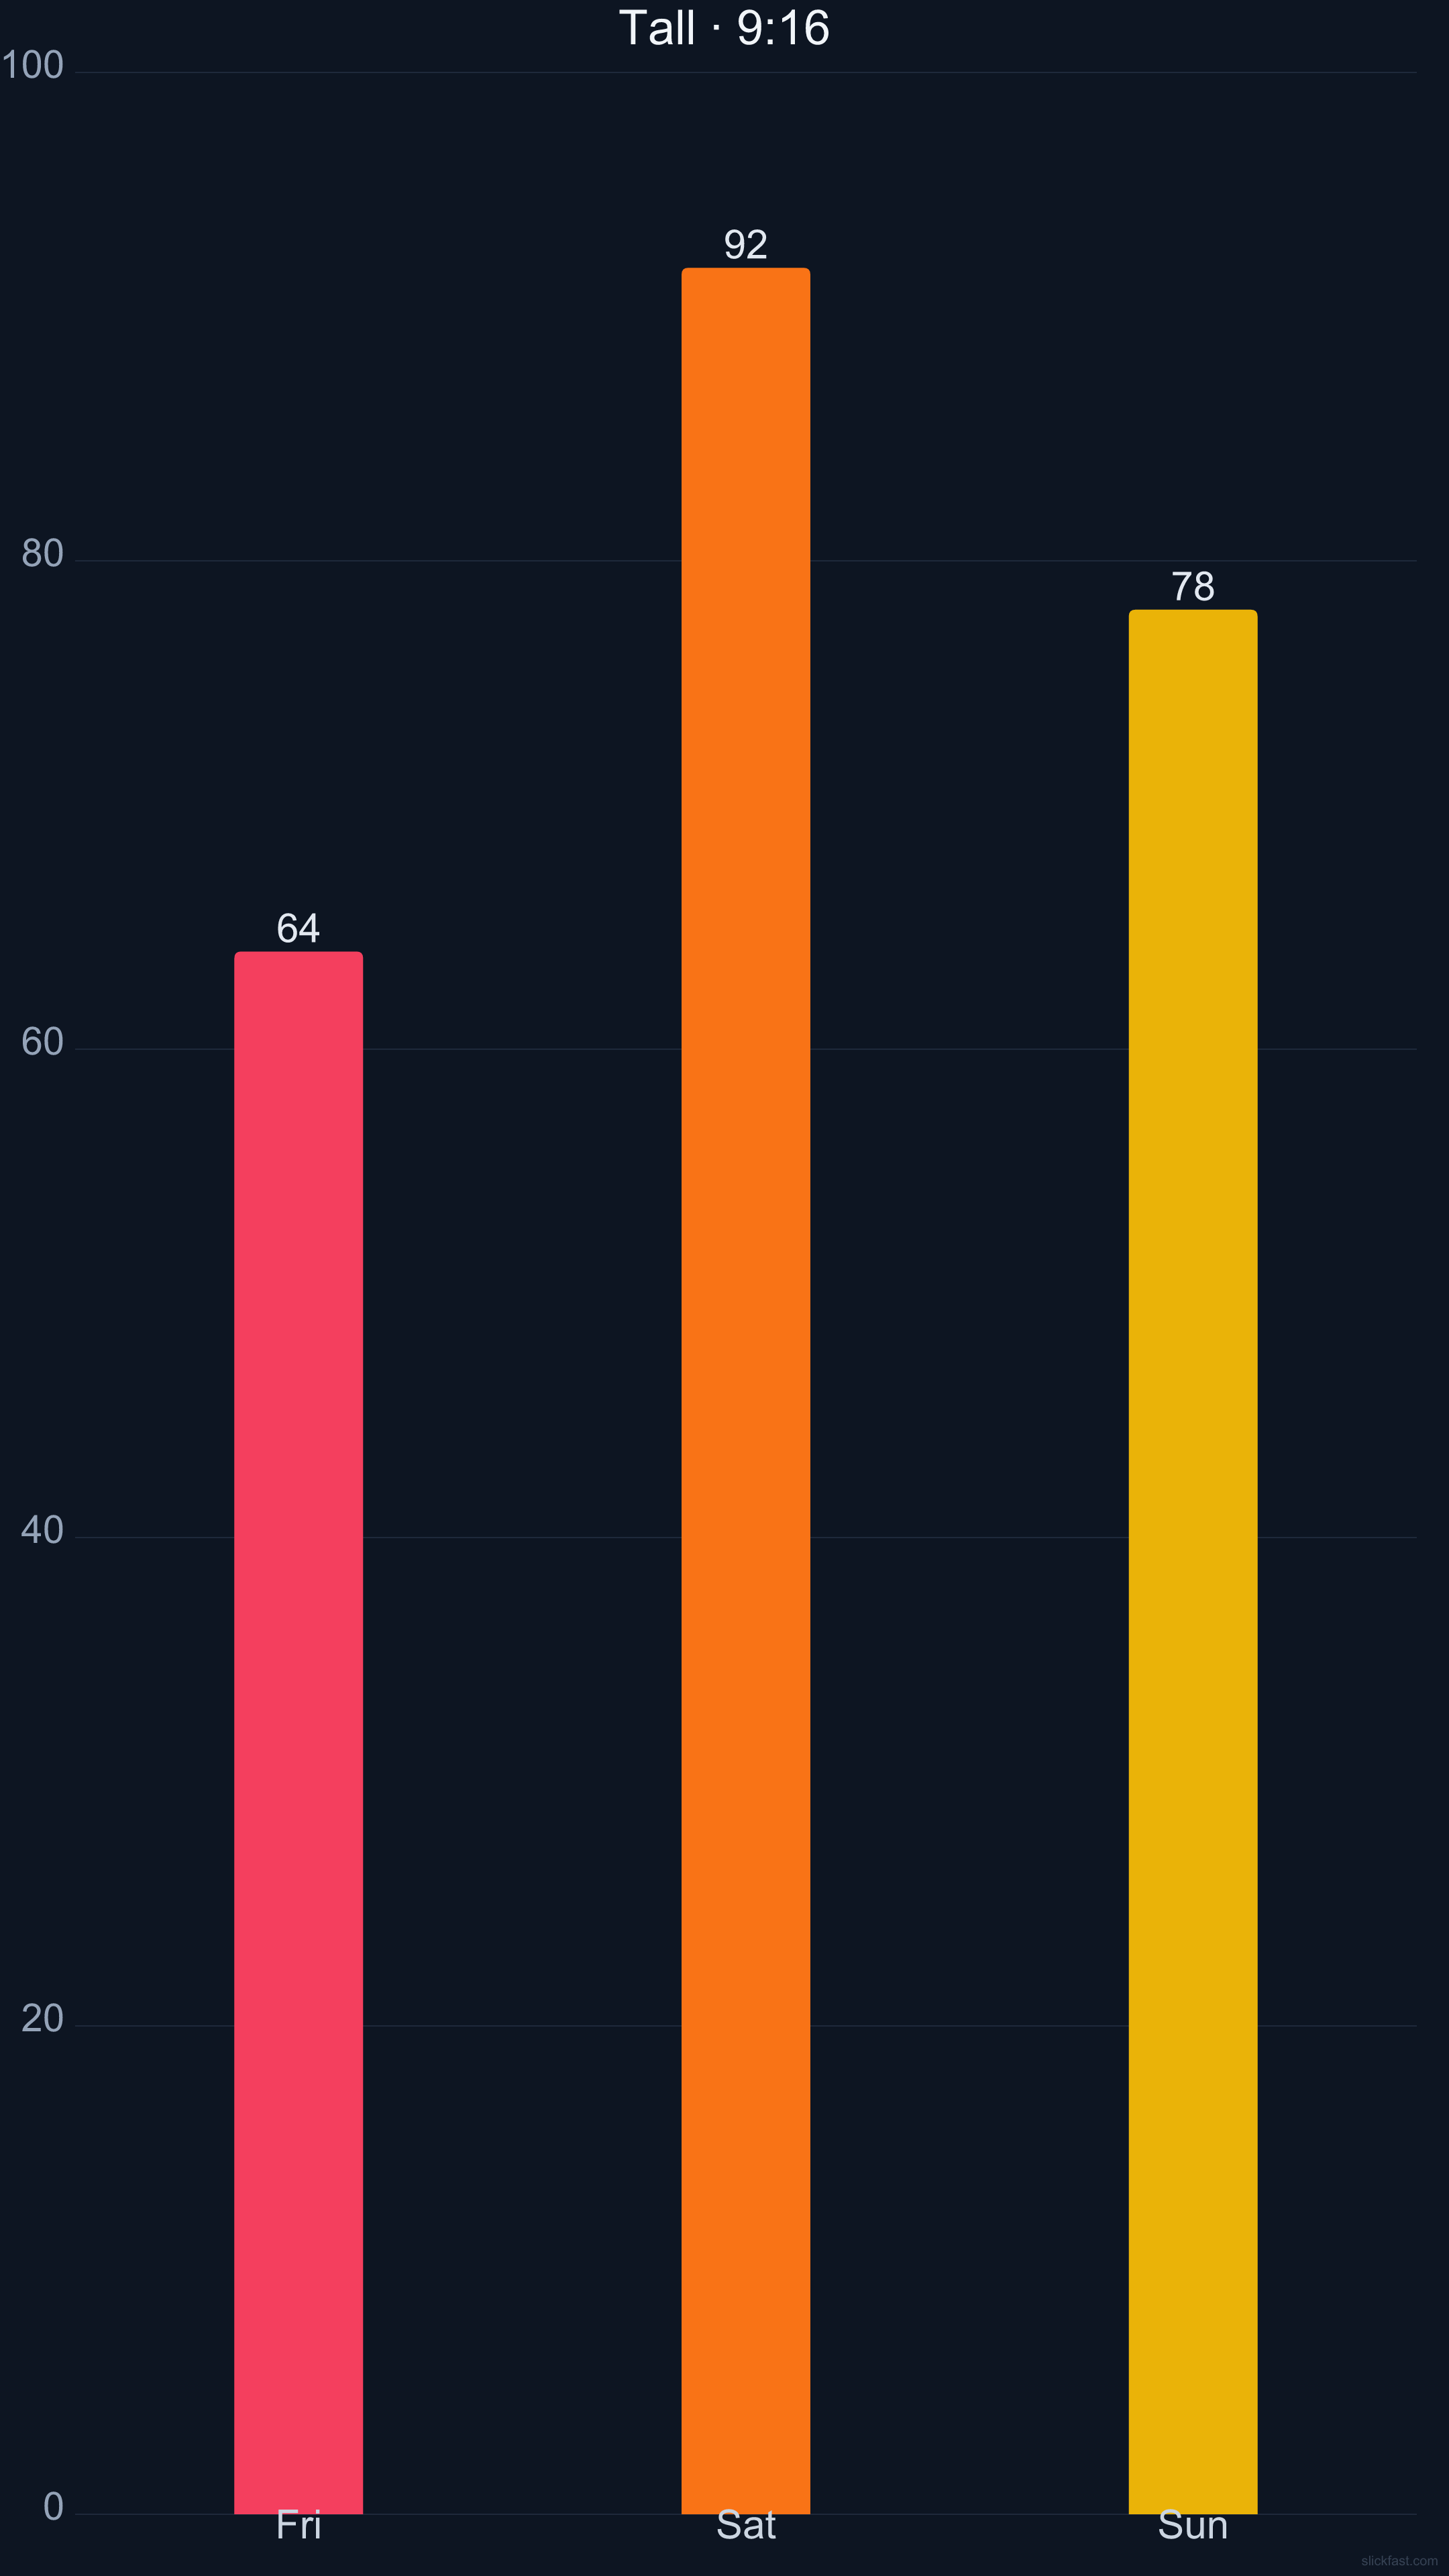
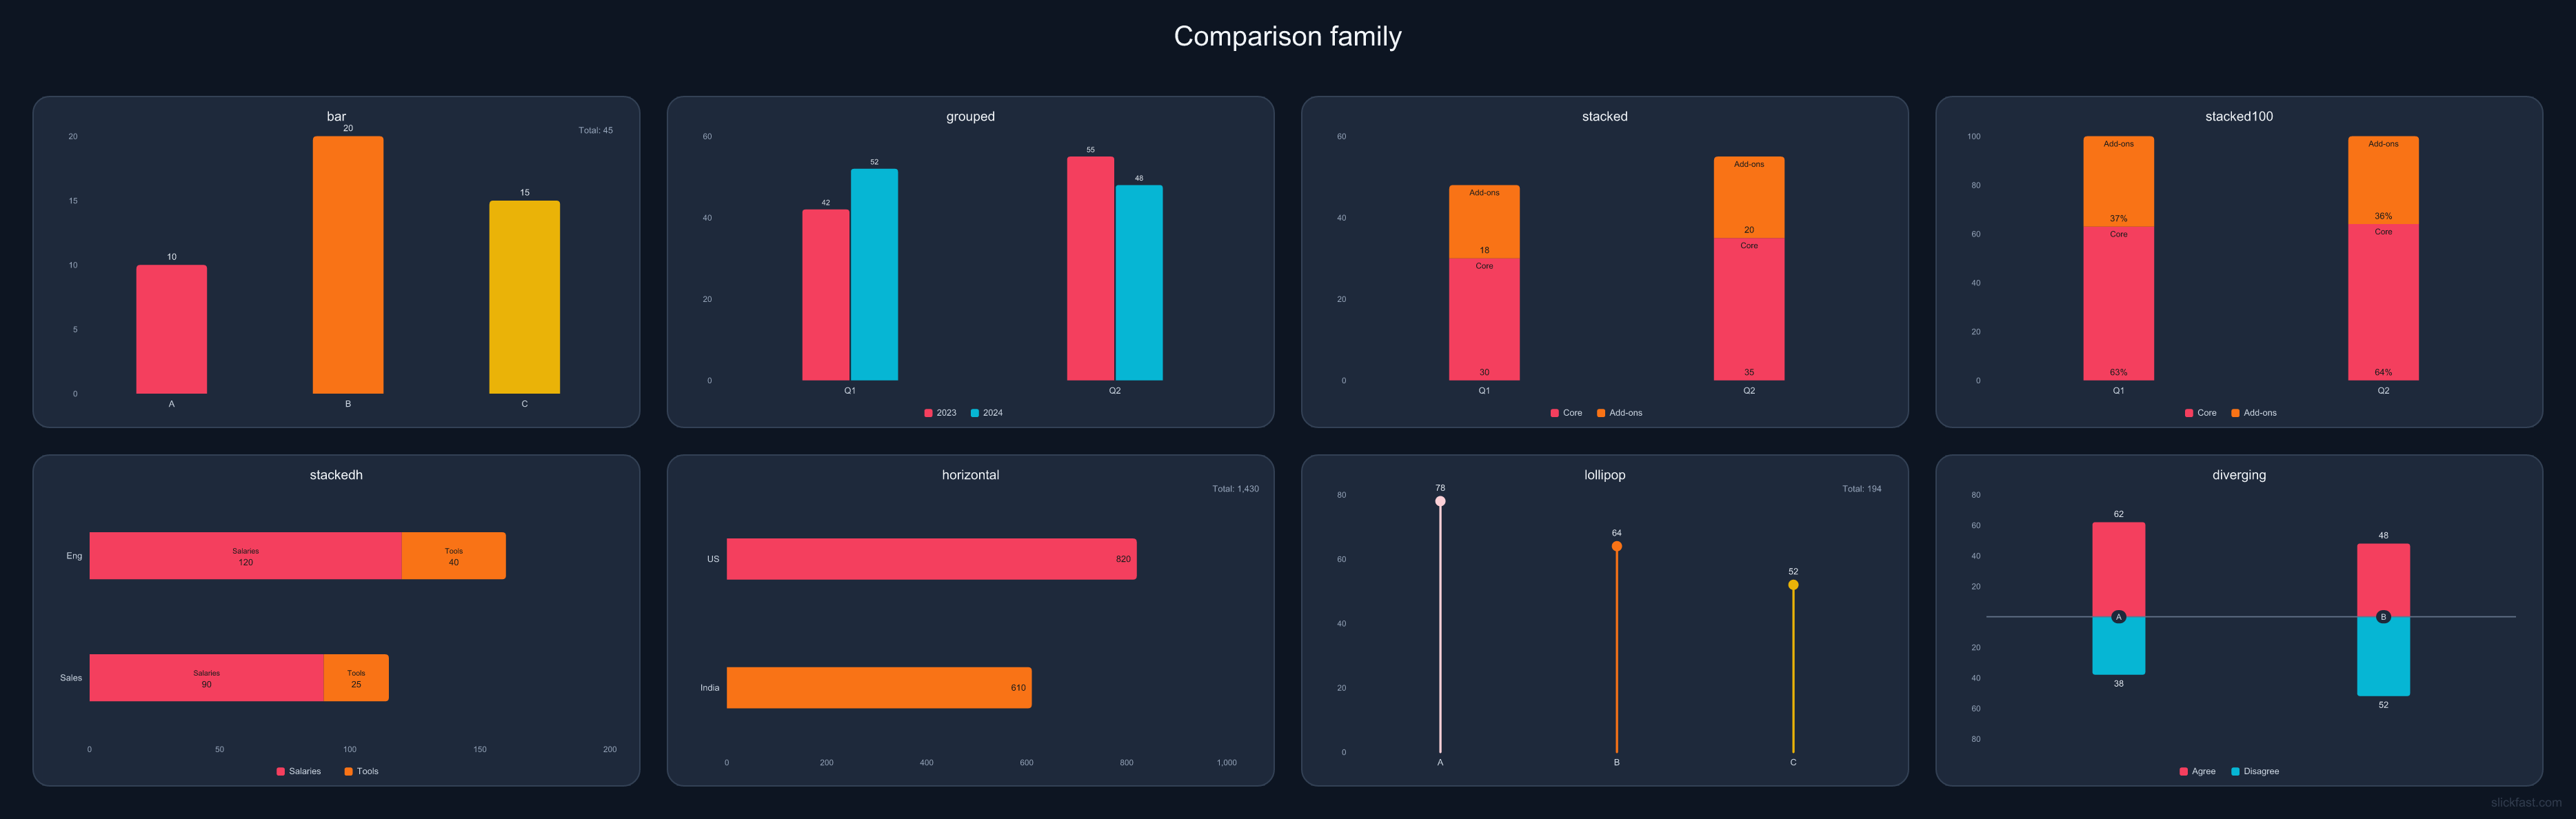
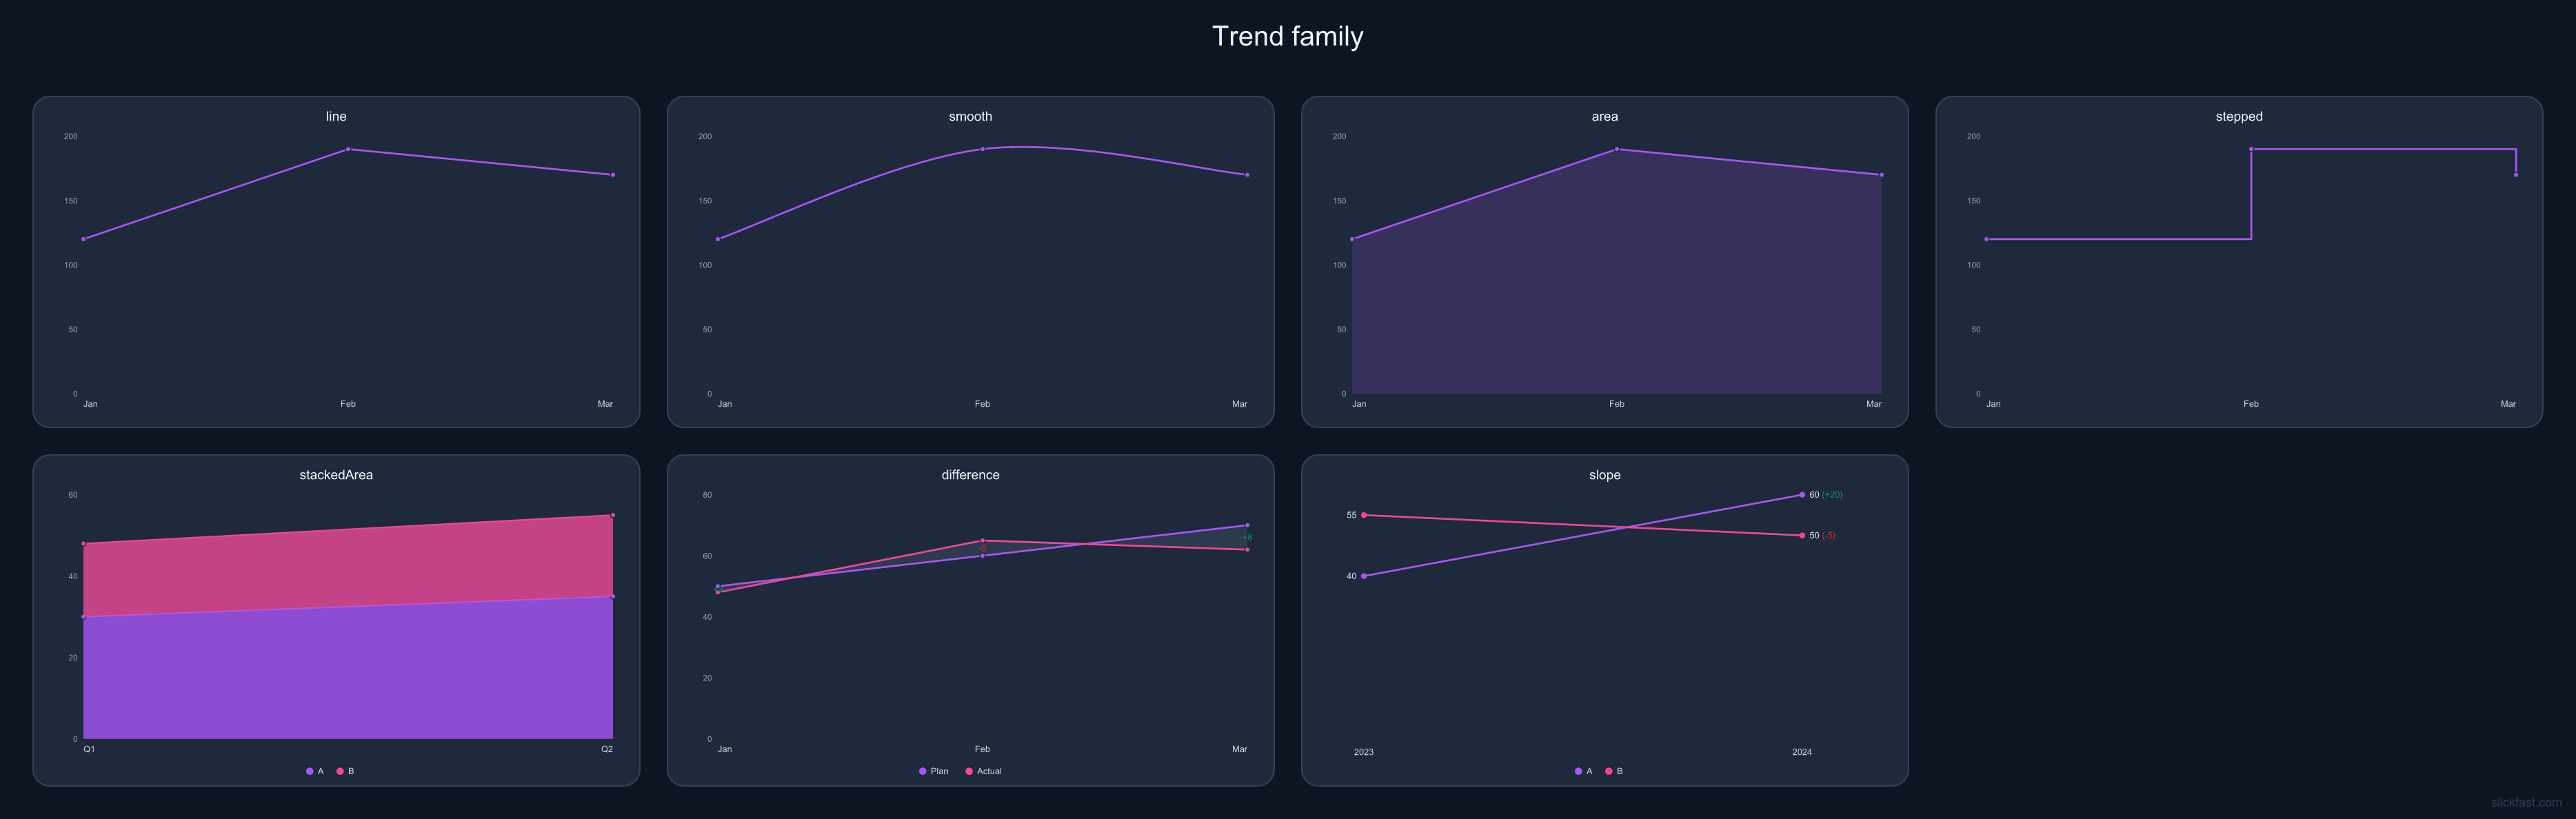
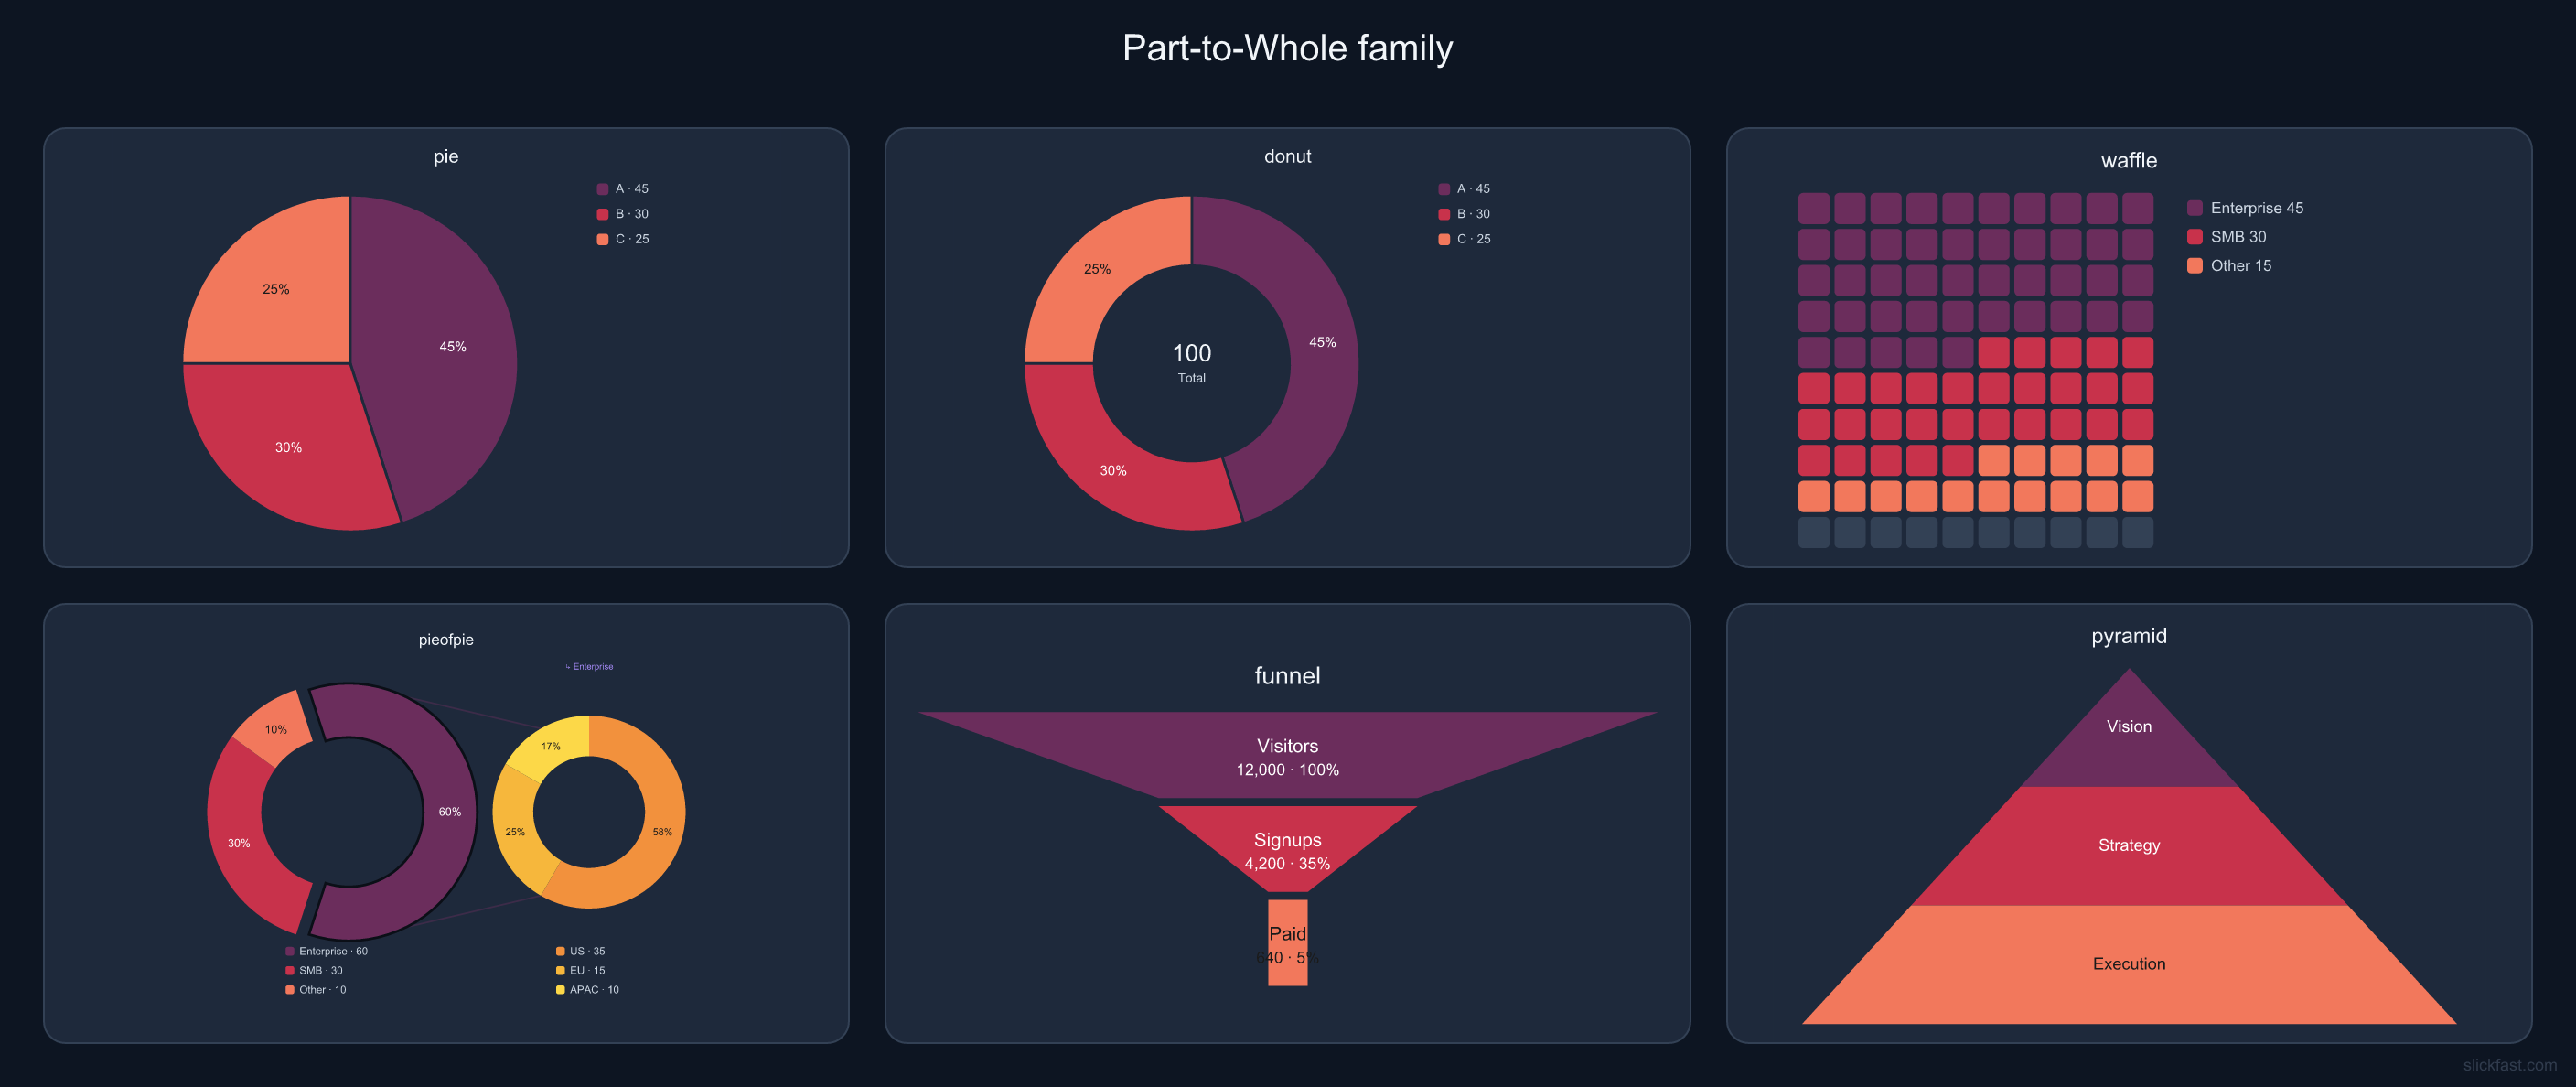
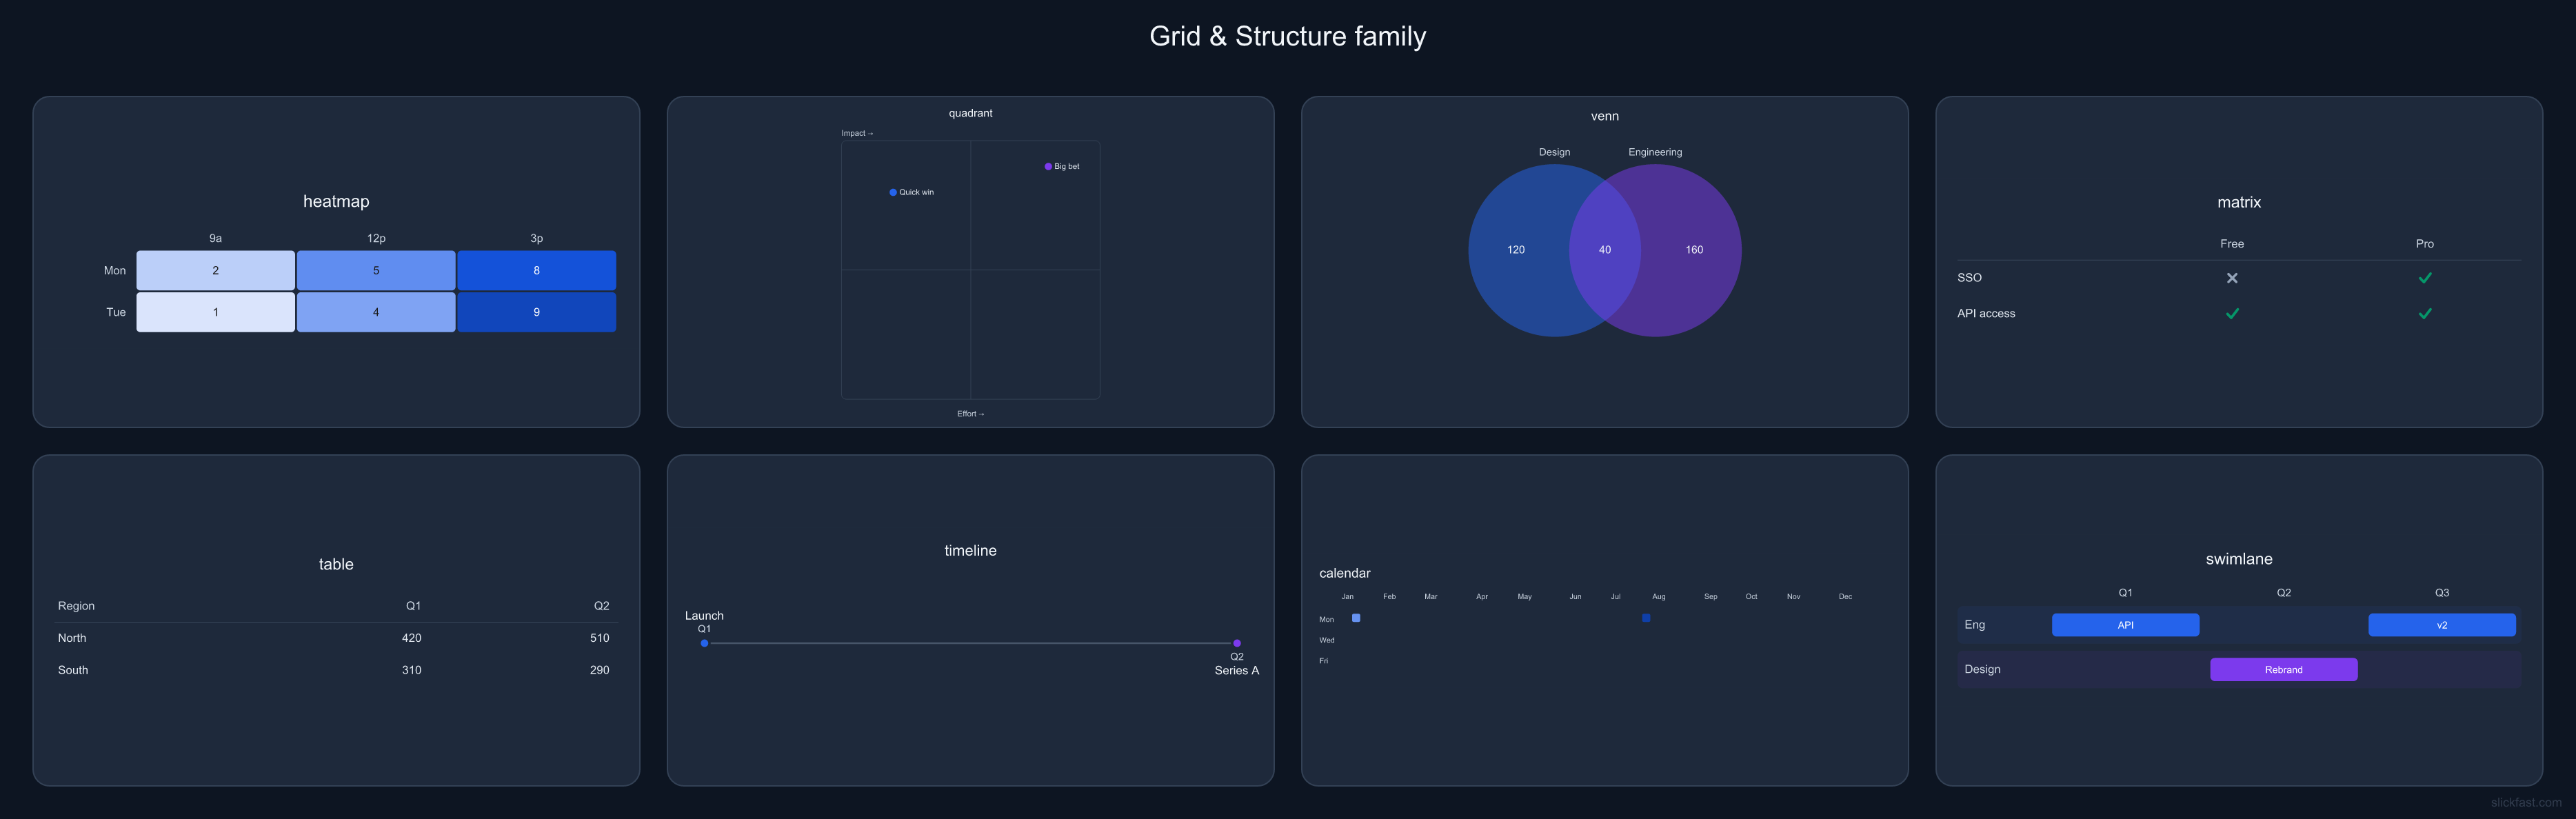
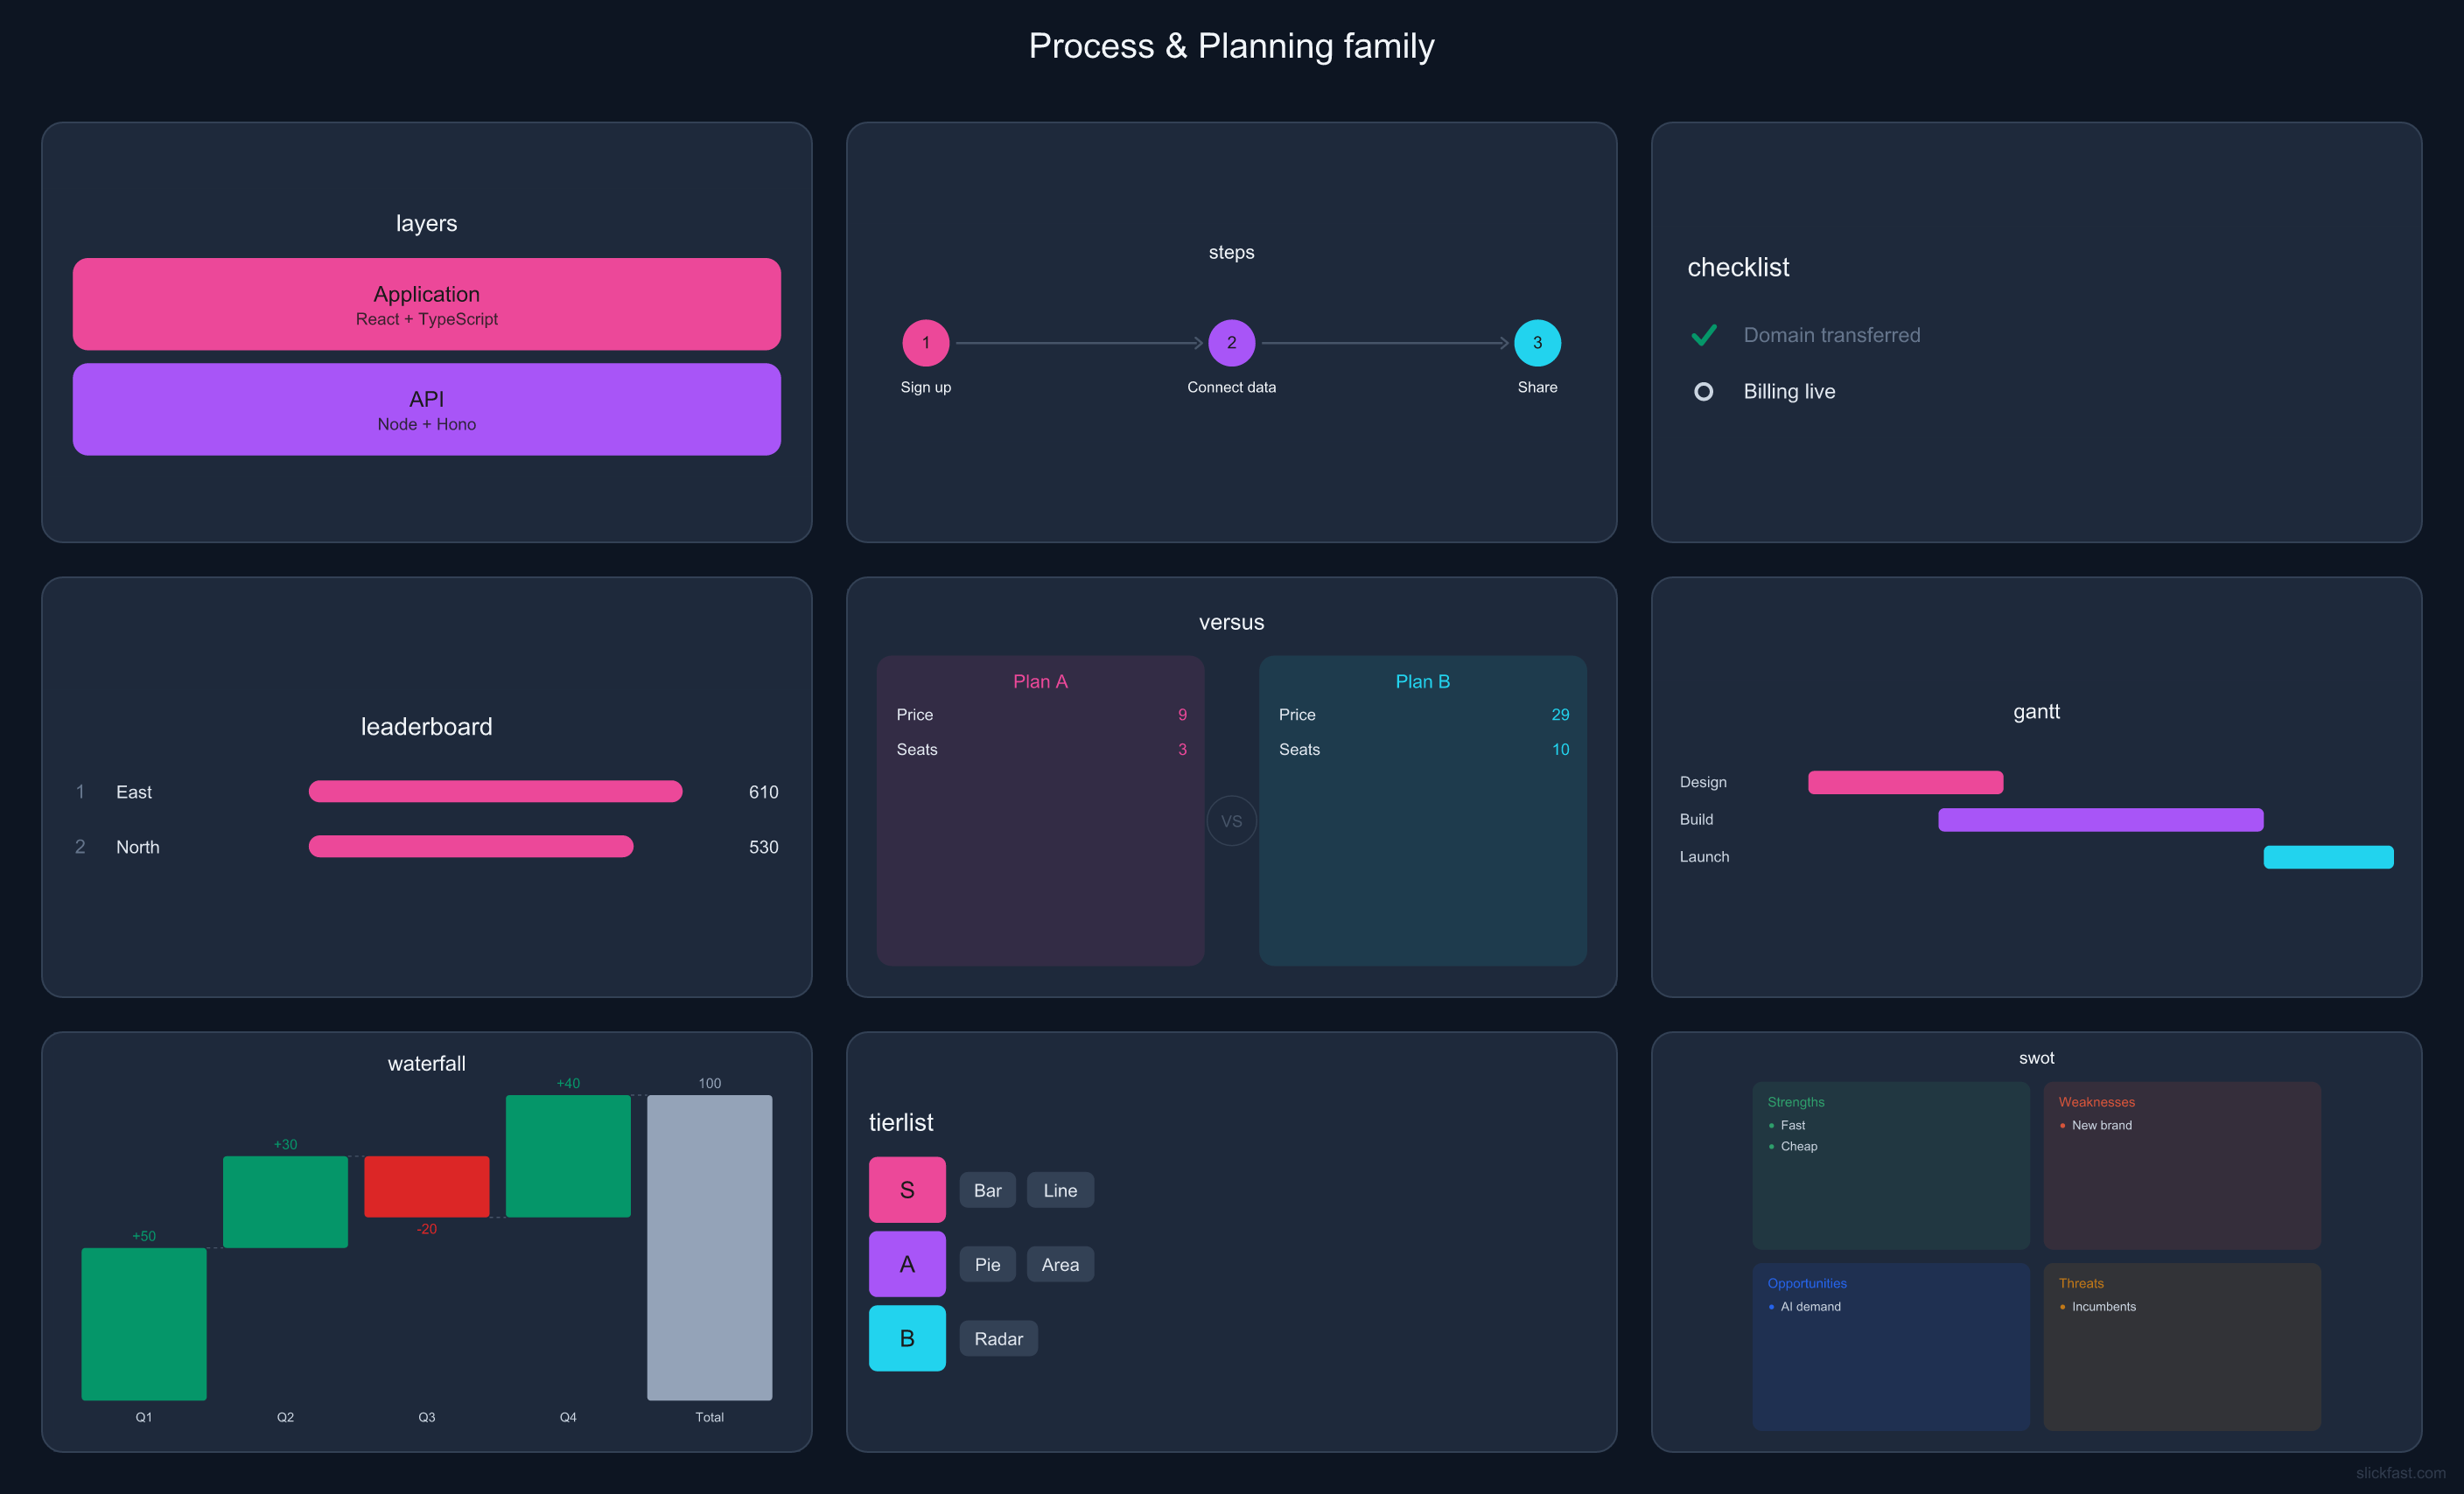
Charts & dashboards for AI agents & automations
A tiny JSON spec in → a finished, retina-quality chart out. Native SVG in milliseconds, no headless browser, deterministic — same spec, same chart, every time — and 100% local via MCP.
Free with your agent — the MCP is free forever, unlimited. Plans only exist for hosted chart URLs.
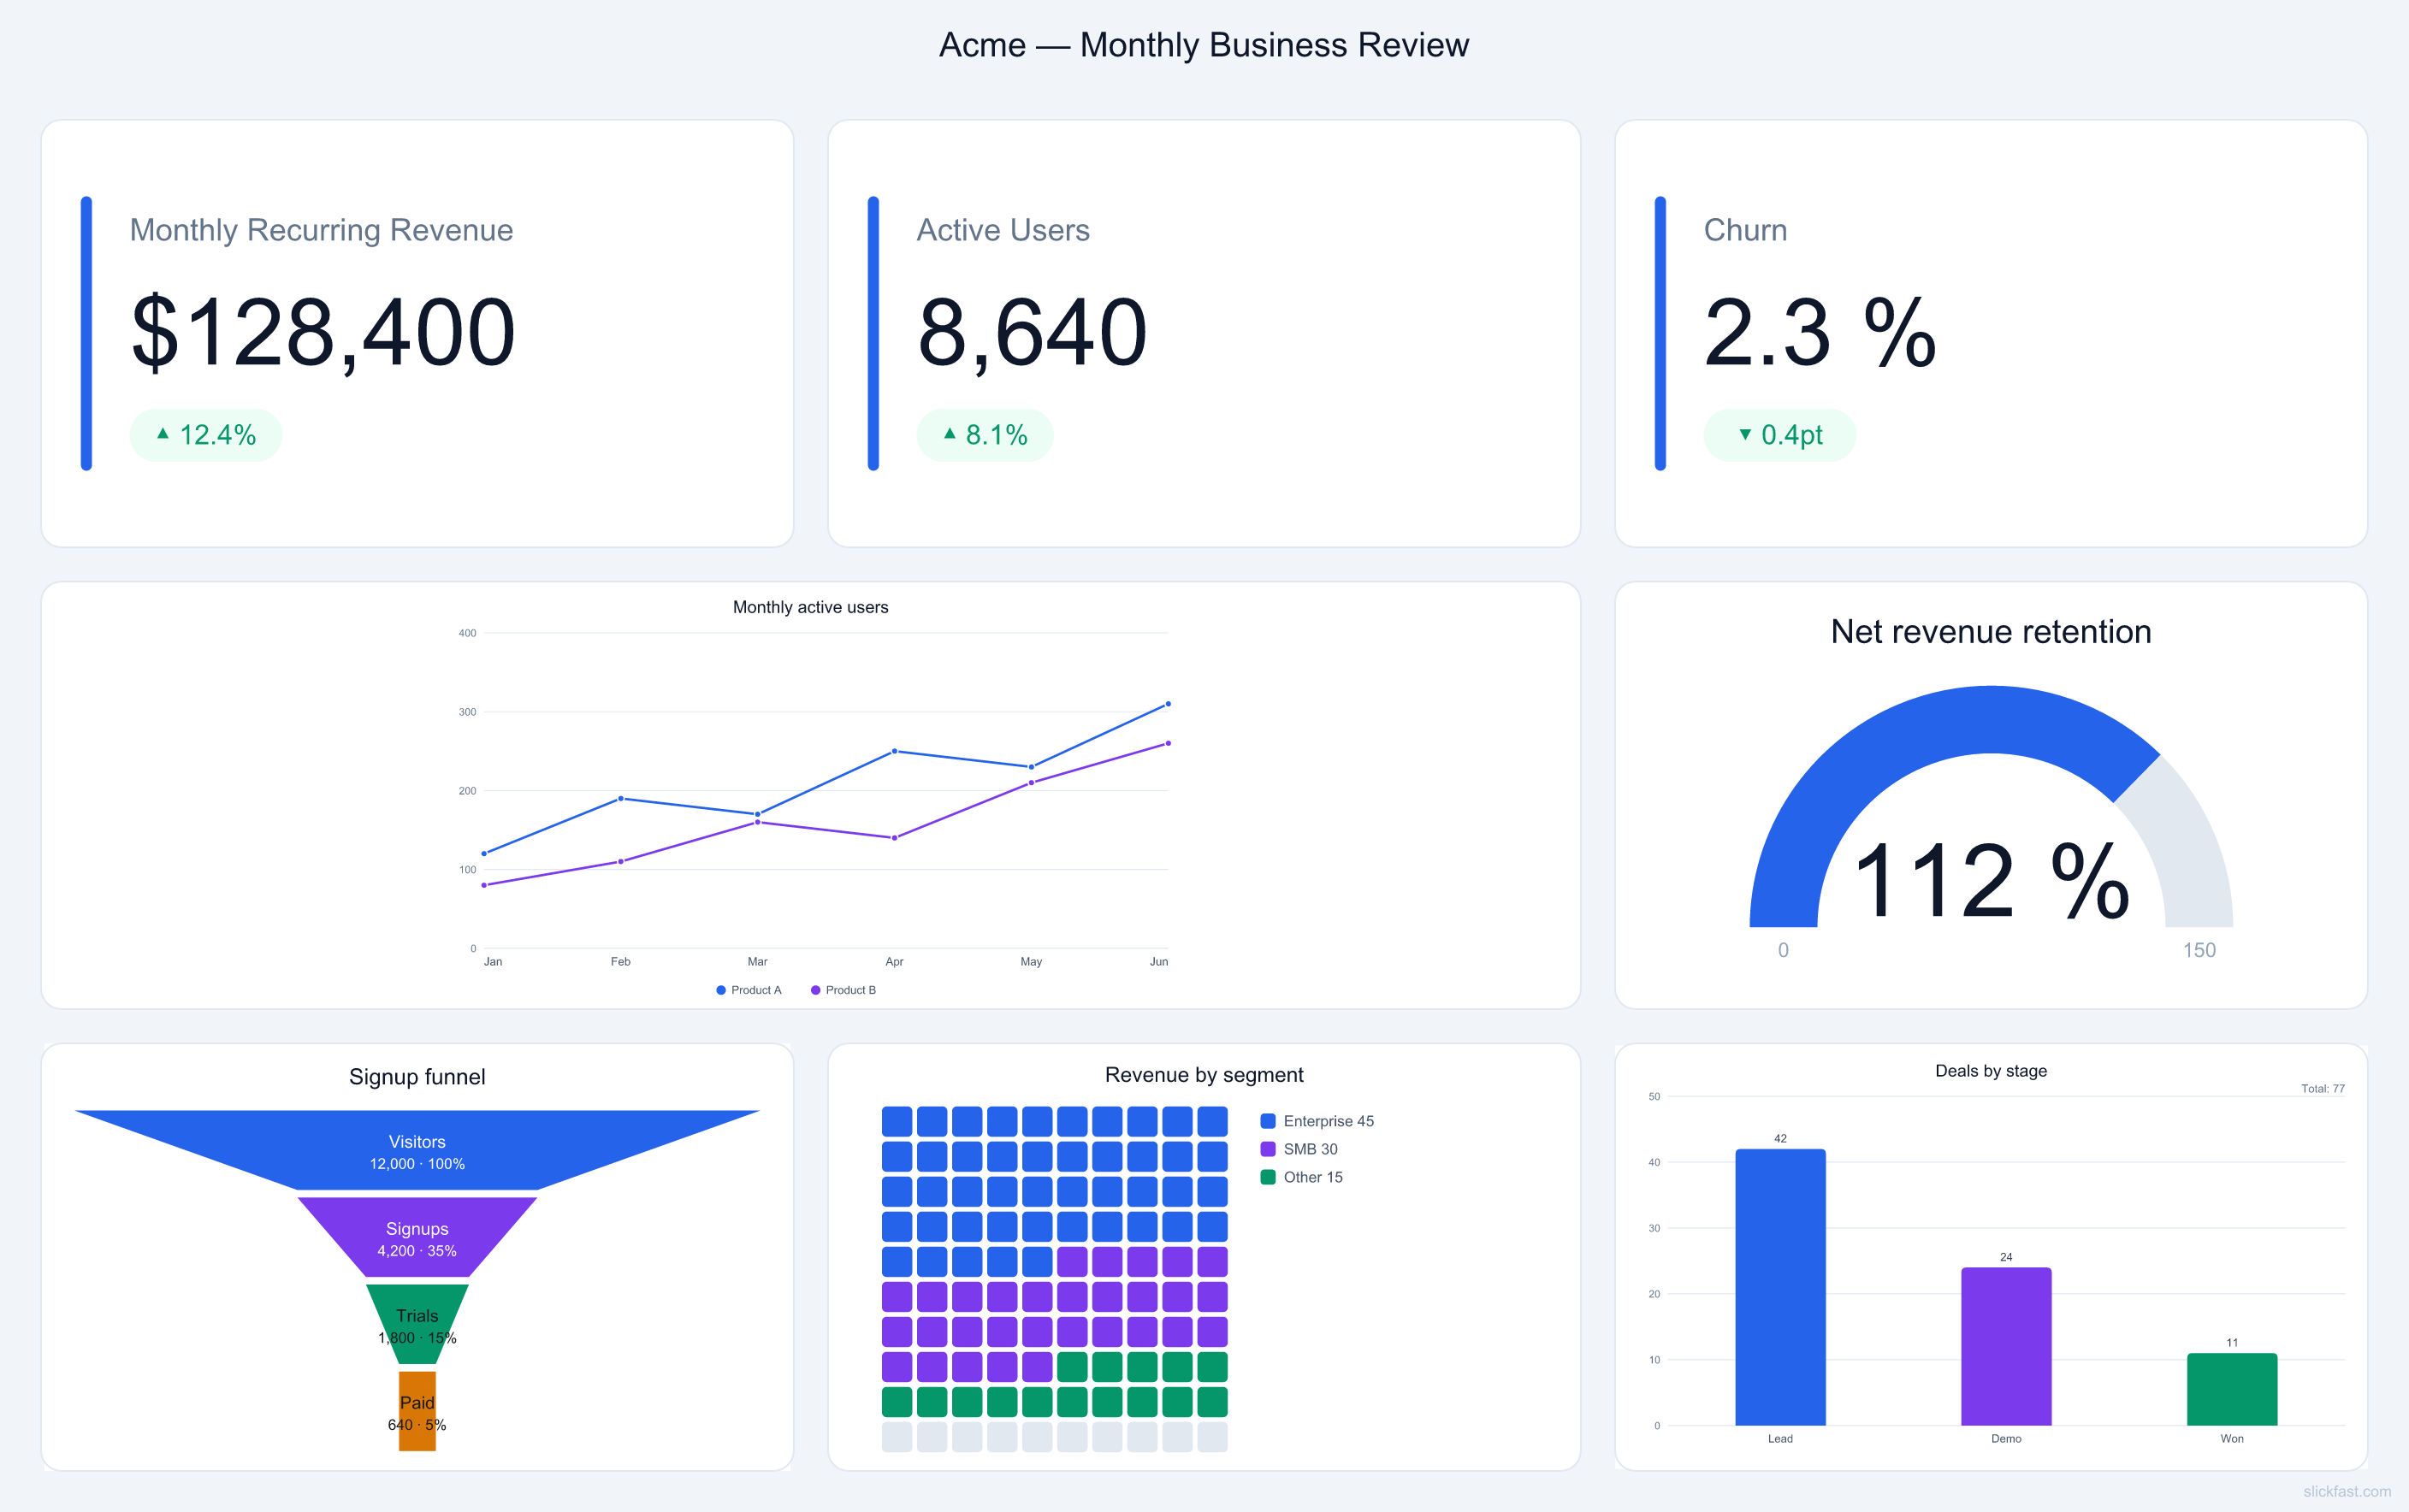
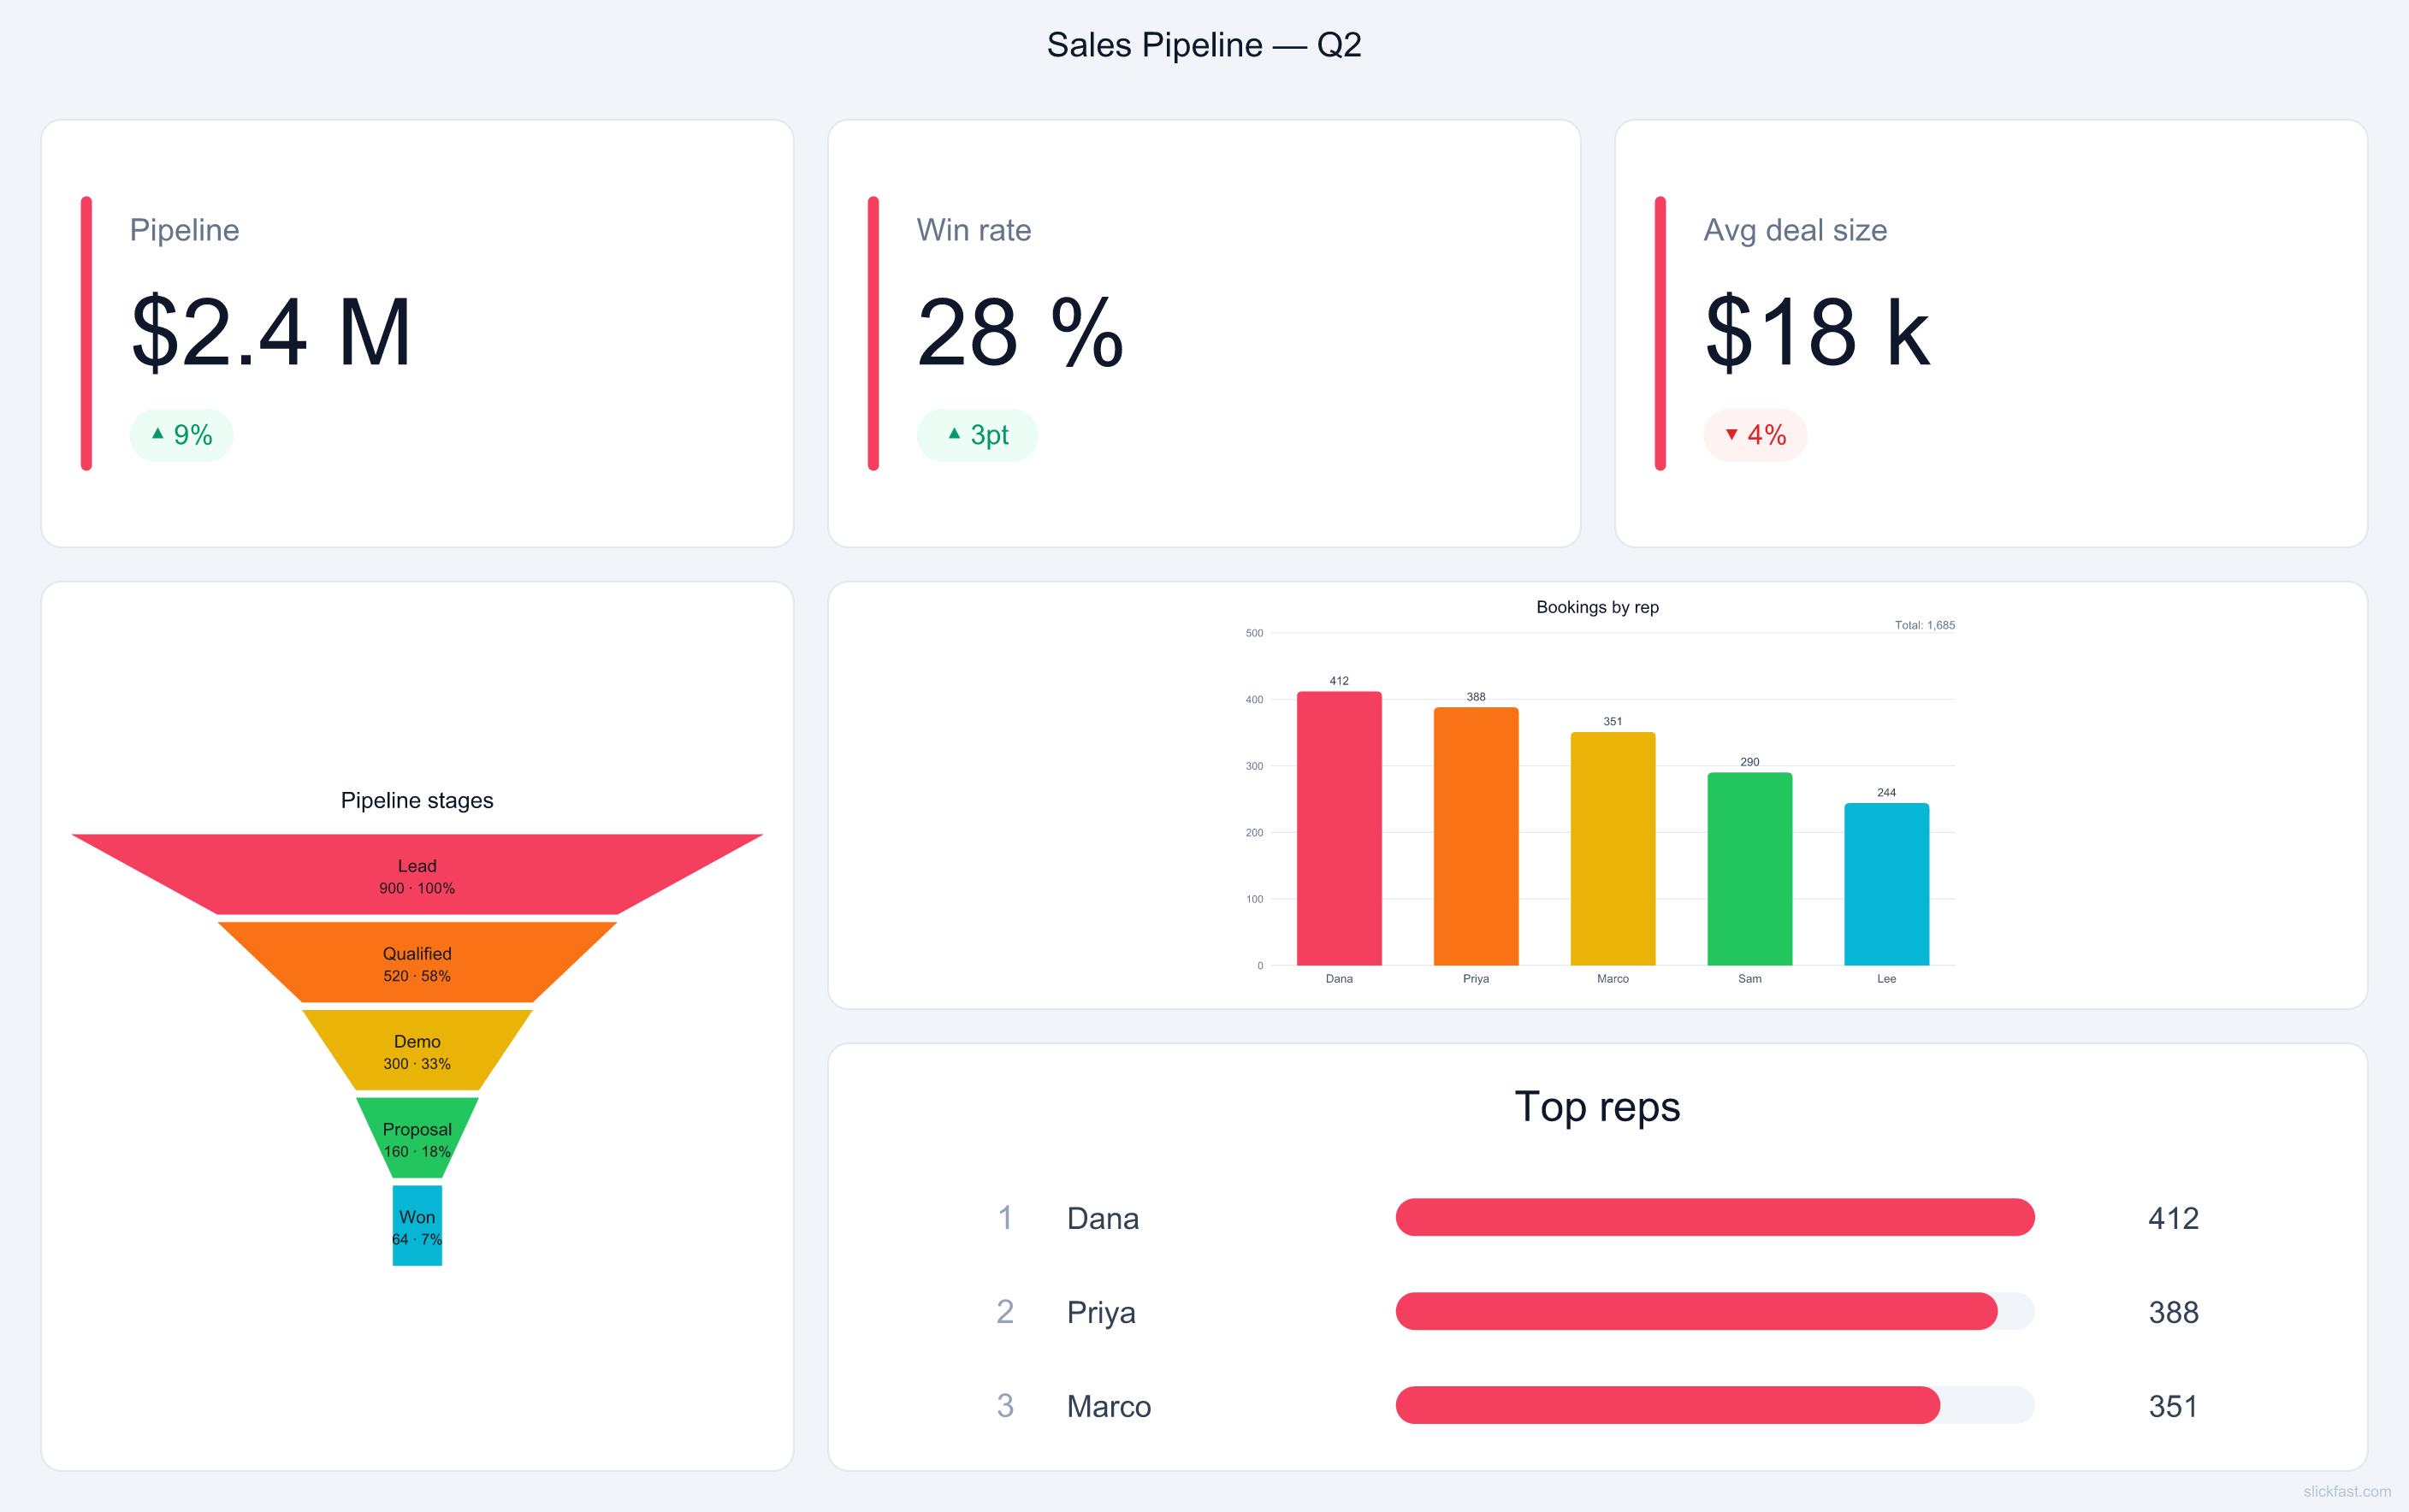
%22%2C%22data%22%3A%7B%22labels%22%3A%5B%22Jan%22%2C%22Feb%22%2C%22Mar%22%2C%22Apr%22%2C%22May%22%2C%22Jun%22%5D%2C%22series%22%3A%5B%7B%22name%22%3A%22Revenue%22%2C%22values%22%3A%5B31%2C34%2C38%2C41%2C44%2C48%5D%7D%5D%7D%7D%2C%22span%22%3A%5B2%2C1%5D%7D%2C%7B%22chart%22%3A%7B%22type%22%3A%22heatmap%22%2C%22title%22%3A%22Signups%20by%20day%22%2C%22columns%22%3A%5B%22Mon%22%2C%22Tue%22%2C%22Wed%22%2C%22Thu%22%2C%22Fri%22%2C%22Sat%22%2C%22Sun%22%5D%2C%22rows%22%3A%5B%22W1%22%2C%22W2%22%2C%22W3%22%2C%22W4%22%5D%2C%22values%22%3A%5B%5B12%2C18%2C14%2C22%2C30%2C8%2C5%5D%2C%5B15%2C21%2C19%2C27%2C34%2C9%2C6%5D%2C%5B18%2C25%2C22%2C31%2C41%2C12%2C8%5D%2C%5B24%2C29%2C27%2C38%2C52%2C15%2C11%5D%5D%7D%2C%22span%22%3A%5B2%2C1%5D%7D%2C%7B%22chart%22%3A%7B%22type%22%3A%22funnel%22%2C%22title%22%3A%22Signup%20%5Cu2192%20paid%22%2C%22stages%22%3A%5B%7B%22label%22%3A%22Visitors%22%2C%22value%22%3A42000%7D%2C%7B%22label%22%3A%22Signups%22%2C%22value%22%3A6100%7D%2C%7B%22label%22%3A%22Activated%22%2C%22value%22%3A3400%7D%2C%7B%22label%22%3A%22Paid%22%2C%22value%22%3A940%7D%5D%7D%2C%22span%22%3A%5B2%2C1%5D%7D%2C%7B%22chart%22%3A%7B%22type%22%3A%22waterfall%22%2C%22title%22%3A%22Cash%20flow%20(%24k)%22%2C%22start%22%3A120%2C%22steps%22%3A%5B%7B%22label%22%3A%22Revenue%22%2C%22value%22%3A48%7D%2C%7B%22label%22%3A%22Infra%22%2C%22value%22%3A-6%7D%2C%7B%22label%22%3A%22Payroll%22%2C%22value%22%3A-38%7D%2C%7B%22label%22%3A%22Marketing%22%2C%22value%22%3A-11%7D%2C%7B%22label%22%3A%22Other%22%2C%22value%22%3A-4%7D%5D%2C%22totalLabel%22%3A%22End%20Q2%22%7D%2C%22span%22%3A%5B2%2C1%5D%7D%5D%7D)
Live — this image is rendered by
api.slickfast.com from that exact spec. The URL is the chart; rendered
once, then served from the CDN edge.
1,546 chars of JSON → the whole dashboard above, in one call. See the spec
{"type":"dashboard","title":"ACME SaaS — Executive Snapshot · rendered by api.slickfast.com in one call","background":"#0f172a","palette":"Vibrant","layout":{"cols":4,"tileHeight":230},"tiles":[{"chart":{"type":"kpi","label":"MRR","value":48250,"valuePrefix":"$","delta":12.4,"sparkline":[31,34,33,38,41,44,48]}},{"chart":{"type":"kpi","label":"Churn","value":2.1,"valueUnit":"%","delta":-0.6,"deltaGoodWhen":"down"}},{"chart":{"type":"gauge","title":"NPS","value":62,"max":100}},{"chart":{"type":"donut","title":"Revenue mix","data":{"labels":["Pro","Scale","Services"],"series":[{"values":[58,31,11]}]},"valueUnit":"%"}},{"chart":{"type":"area","title":"Revenue trend ($k)","data":{"labels":["Jan","Feb","Mar","Apr","May","Jun"],"series":[{"name":"Revenue","values":[31,34,38,41,44,48]}]}},"span":[2,1]},{"chart":{"type":"heatmap","title":"Signups by day","columns":["Mon","Tue","Wed","Thu","Fri","Sat","Sun"],"rows":["W1","W2","W3","W4"],"values":[[12,18,14,22,30,8,5],[15,21,19,27,34,9,6],[18,25,22,31,41,12,8],[24,29,27,38,52,15,11]]},"span":[2,1]},{"chart":{"type":"funnel","title":"Signup → paid","stages":[{"label":"Visitors","value":42000},{"label":"Signups","value":6100},{"label":"Activated","value":3400},{"label":"Paid","value":940}]},"span":[2,1]},{"chart":{"type":"waterfall","title":"Cash flow ($k)","start":120,"steps":[{"label":"Revenue","value":48},{"label":"Infra","value":-6},{"label":"Payroll","value":-38},{"label":"Marketing","value":-11},{"label":"Other","value":-4}],"totalLabel":"End Q2"},"span":[2,1]}]}