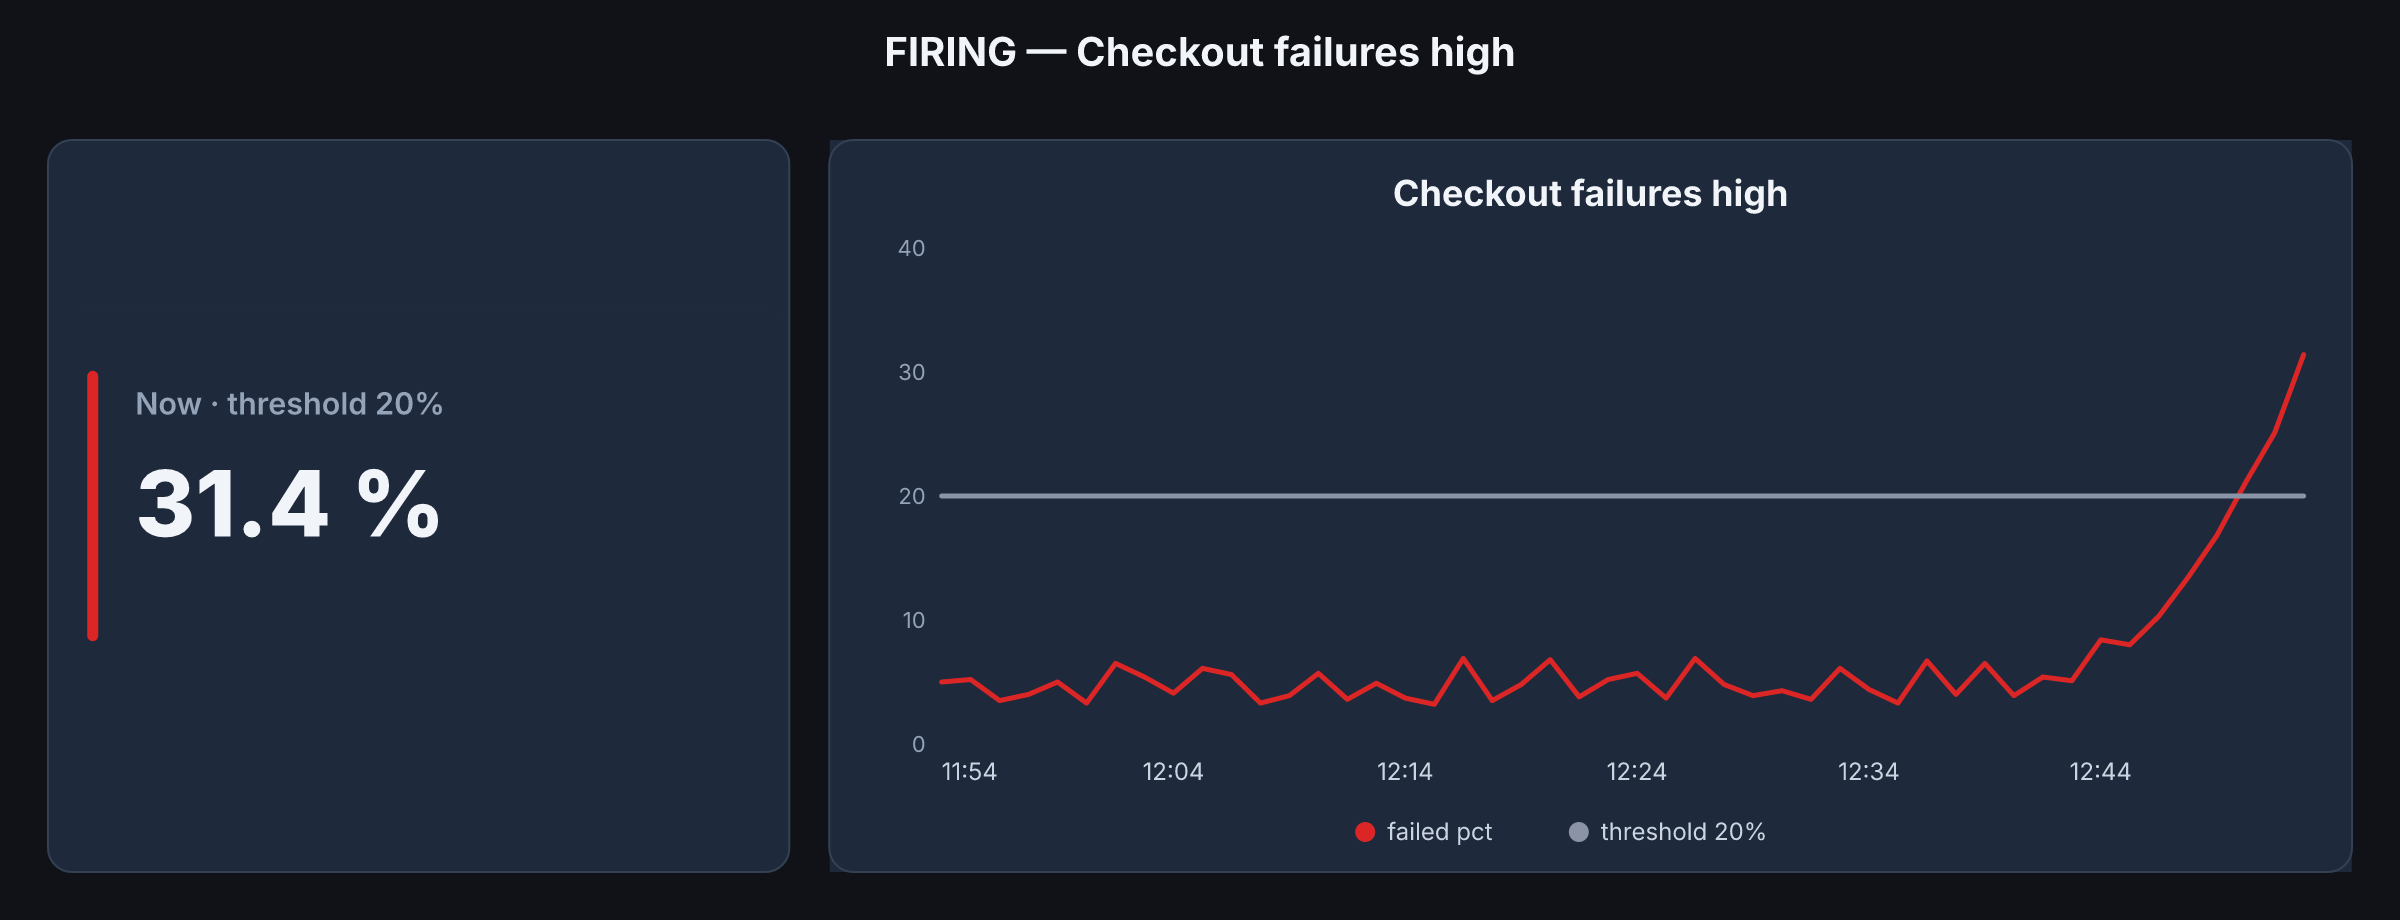
This image is live. Our real numbers right now — npm, CI, commits.
Nobody re-uploads it. Charts and boards in the gallery ↓
Same picture forever. Survival, volcano, real log axes — same engine, free. No headless browser.
Local MCP is free forever — charts, boards, and scientific types on your machine, no key.
A public Page or hosted chart URL uses a key. Free Pages last 7 days and carry a watermark; paid Pages stay.
Hosted links are unlisted, not private — anyone with the URL (and the .json twin) can see it.
This homepage is not one. A Page is headline, words, charts, layout — at a URL.
The button opens a real one. Every Page has a twin: the exact recipe, at that URL plus
.json. That isn’t an export; it’s the source. The fingerprint on the Page must match it.
Don’t trust us. Check the math.
Free Pages last 7 days and show a watermark. Paid Pages stay.
The link is unlisted, not private — anyone who has it can open the Page and the twin.
Data and design in one JSON. The engine draws it — including scientific plots. Same spec, same picture, byte for byte, forever.
Hero, prose, charts. Publish it. Humans get a URL — the link above is one of those.
The exact recipe. Not an export. If the fingerprint matches, nothing changed.
Visible in the chrome. If it matches the twin, nothing changed. If it doesn’t, something did.
Each of these is a real Page.
They force a browser to paint a picture, then take a
screenshot they can’t even verify. SlickFast doesn’t use a browser. It renders.
Spec in, same bytes out. Forever. The twin at .json is the exact recipe —
the source, not an export. The fingerprint on the Page is the proof it matches.
Don’t trust us. Check the math.
Connect local MCP, then ask. Hosted MCP (claude.ai and cloud agents): paste
https://mcp.slickfast.com/mcp — that path is metered like the API.
After MCP is connected:
“Show me the SlickFast gallery.”
“Render a bar chart of Q1: Jan 42, Feb 58, Mar 71.”
“Describe the volcano type, then render one.”
Or call get_started, then news.
Publish needs a key (free tier is fine):
“Publish a SlickFast Page with that chart, a headline, and a short note.”
You get a URL. Add .json. Free Pages last 7 days and show a watermark. Paid Pages stay.
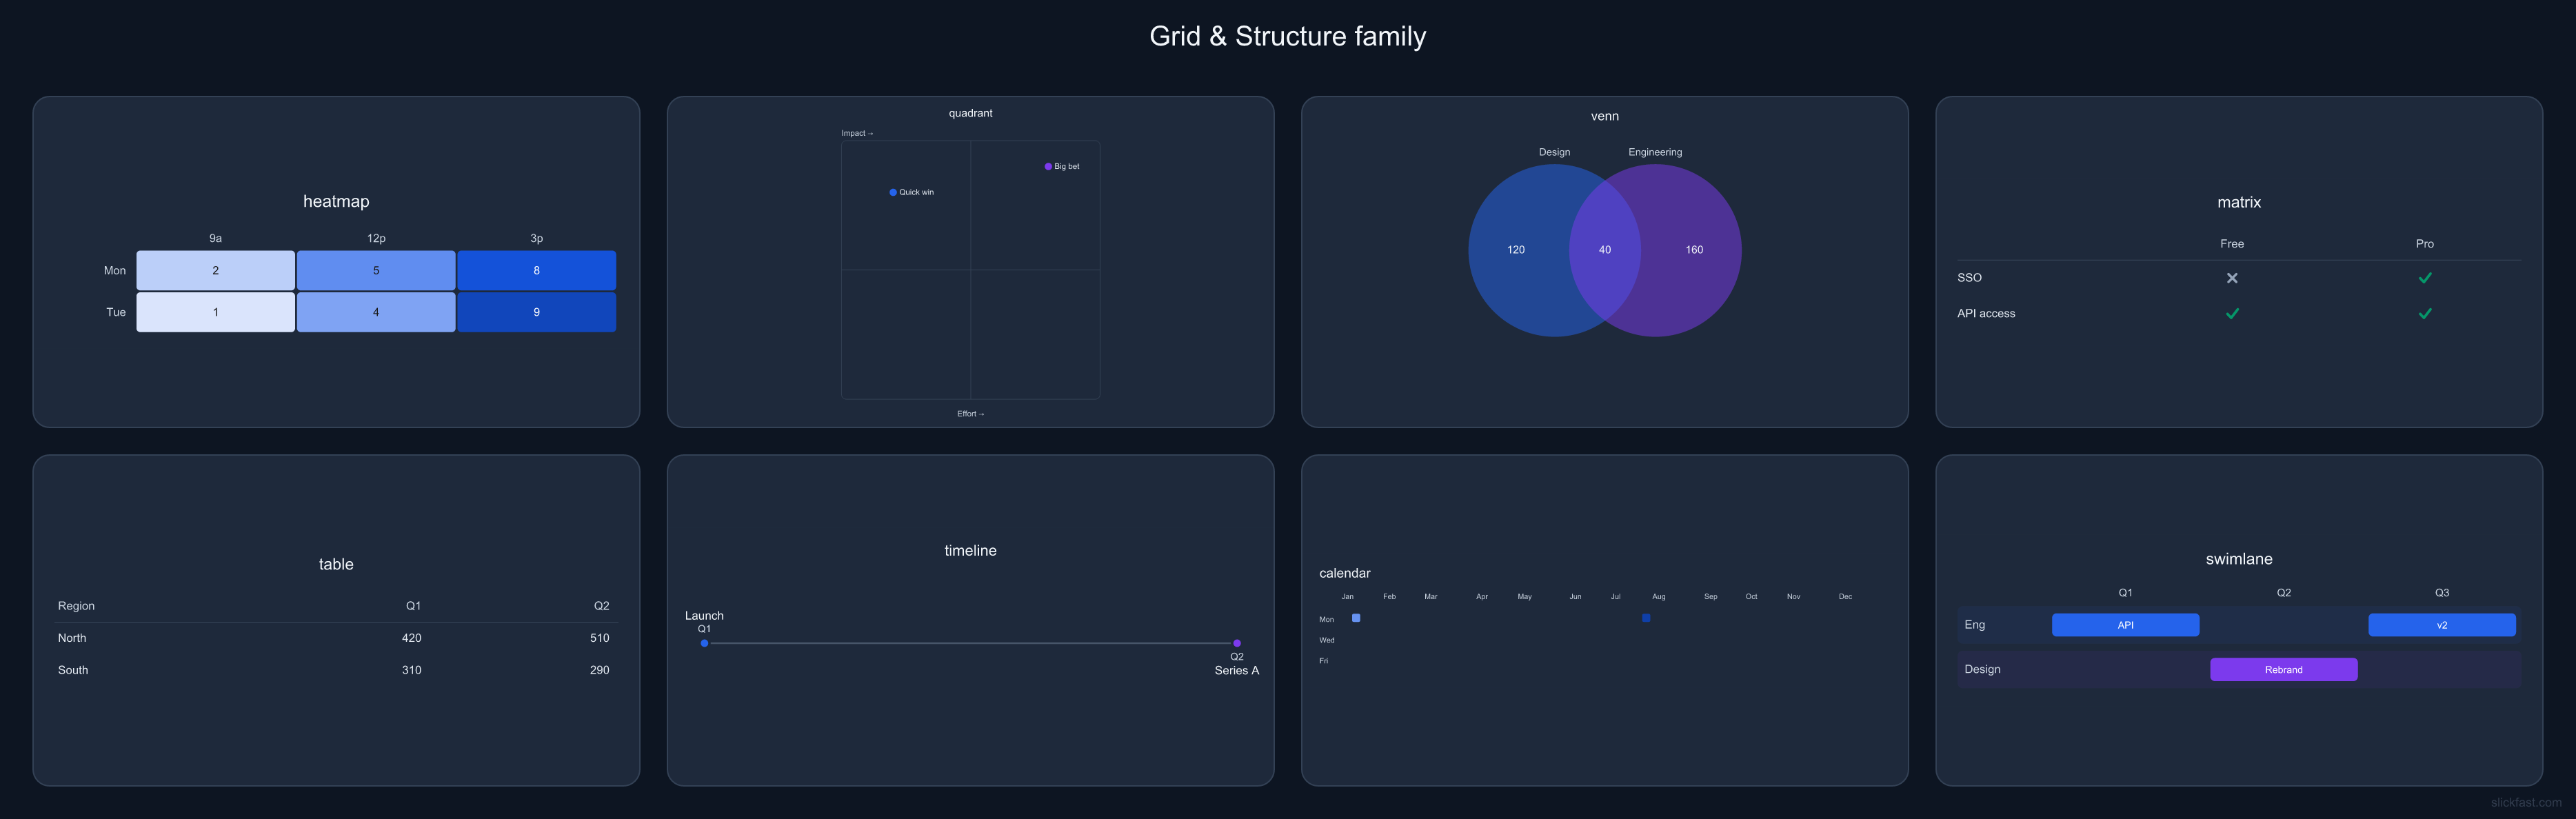
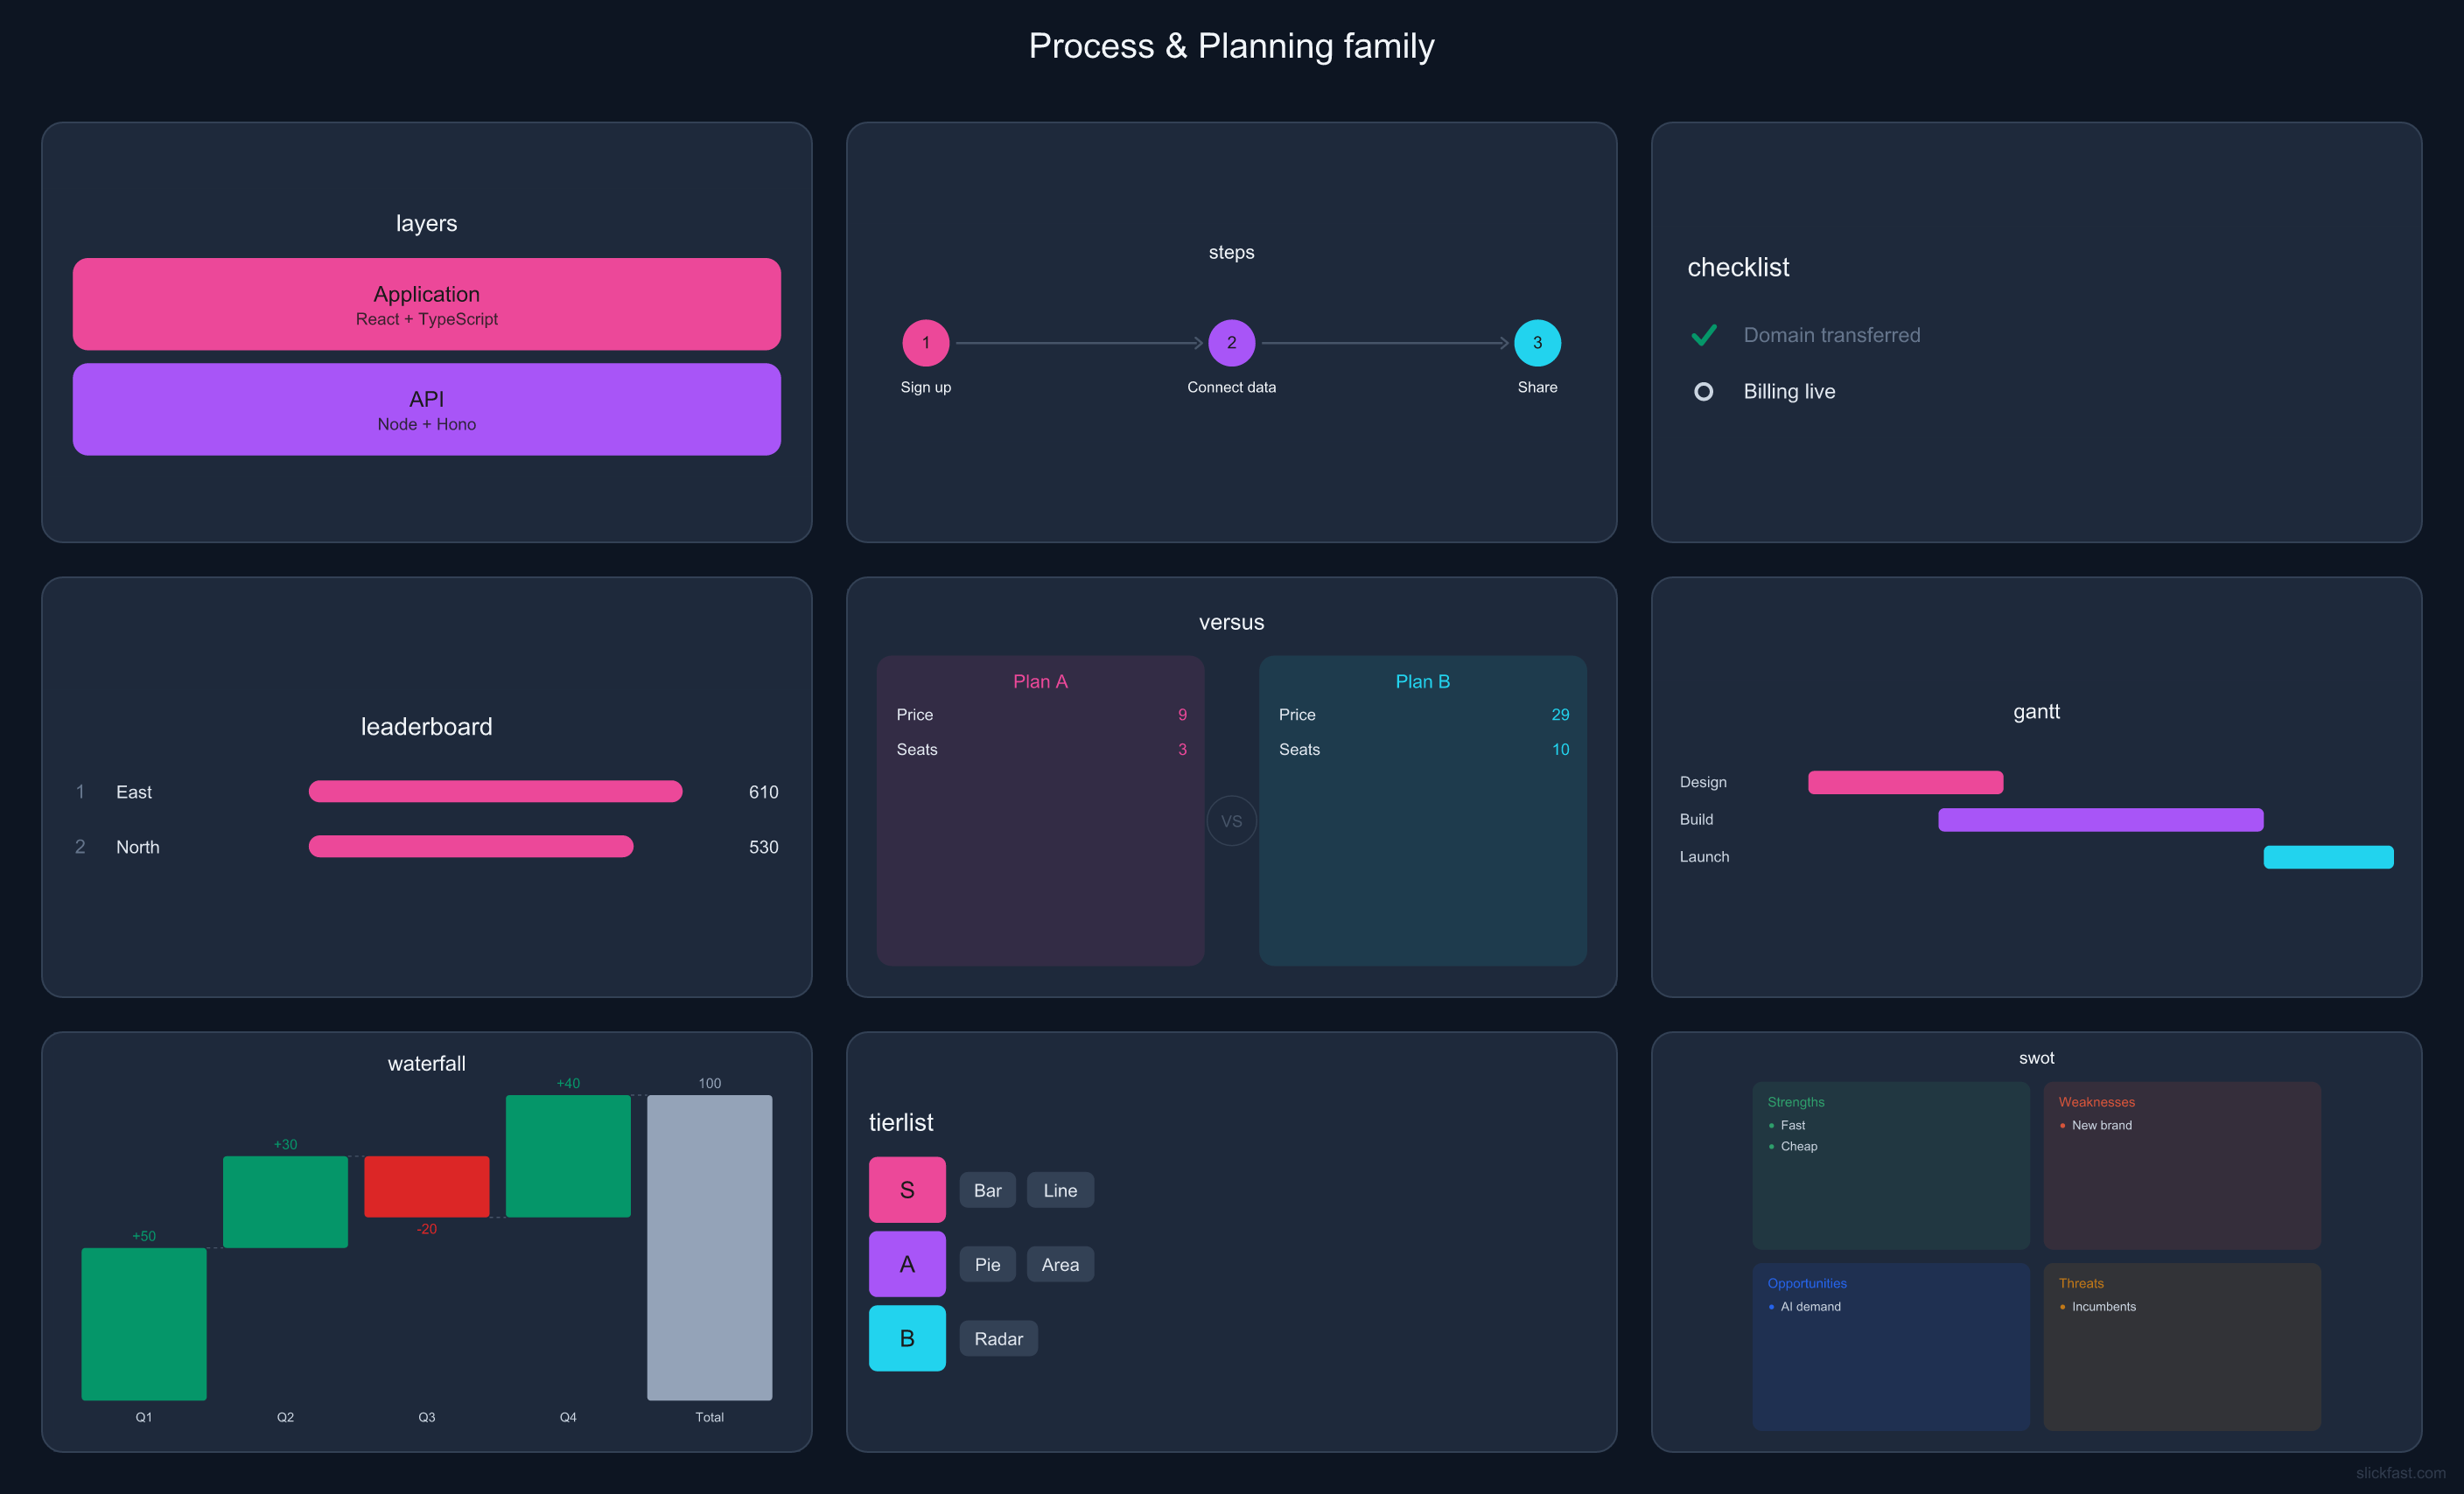
The boards below are the 47. Same engine, not on this board: scatter, survival, volcano, real log axes.
Call describe_type. See News #12 and the night lab.
Nothing below is a mockup — each board is a single SlickFast render:
one spec, one call, many charts tiled into one image. Tiles span columns and rows
(wide, tall, hero-sized), so a board mixes big charts with small stats. Any shape, too —
one ratio field turns the same spec into a share card, a phone-portrait board,
an ultra-wide banner, or an A4 print. Click any image to view it full size.
paletteSingle charts, straight out of the engine. 6 flat palettes and 12 nested themes are built in — name one in the spec and the chart restyles itself, background to legend.
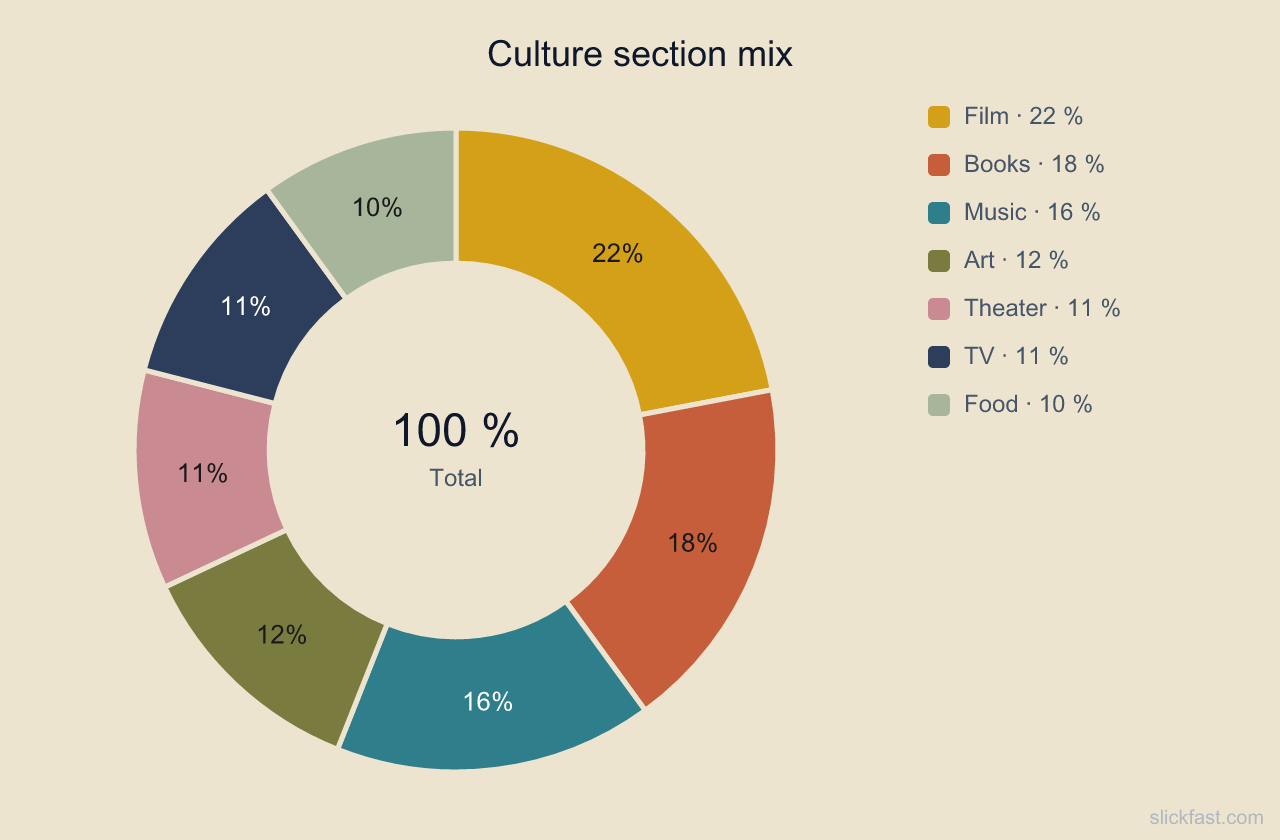
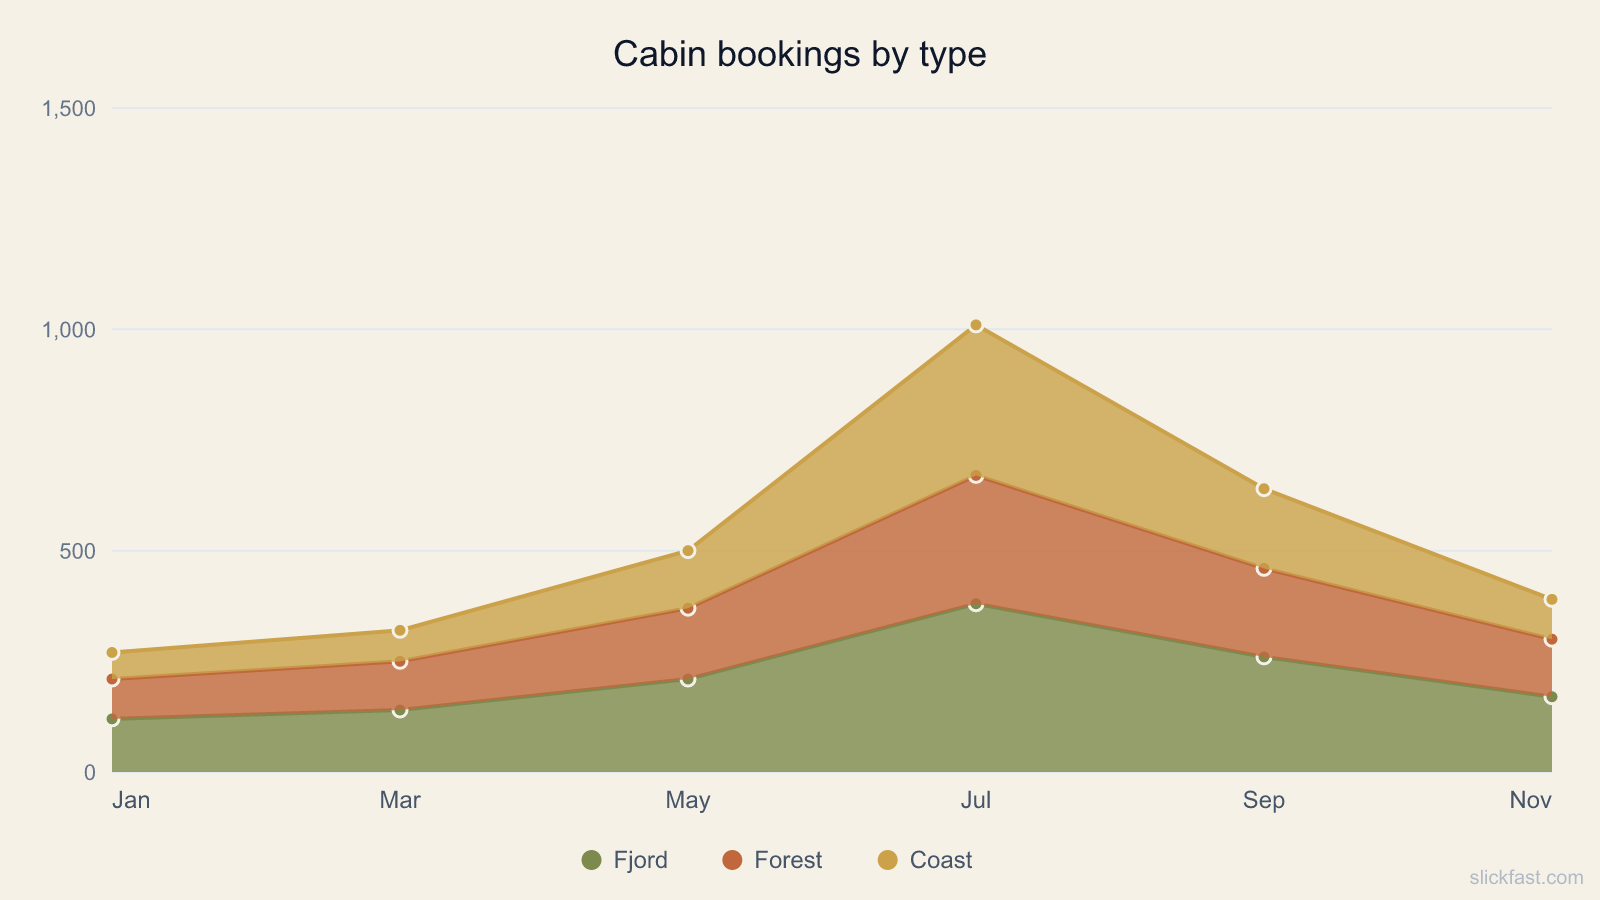
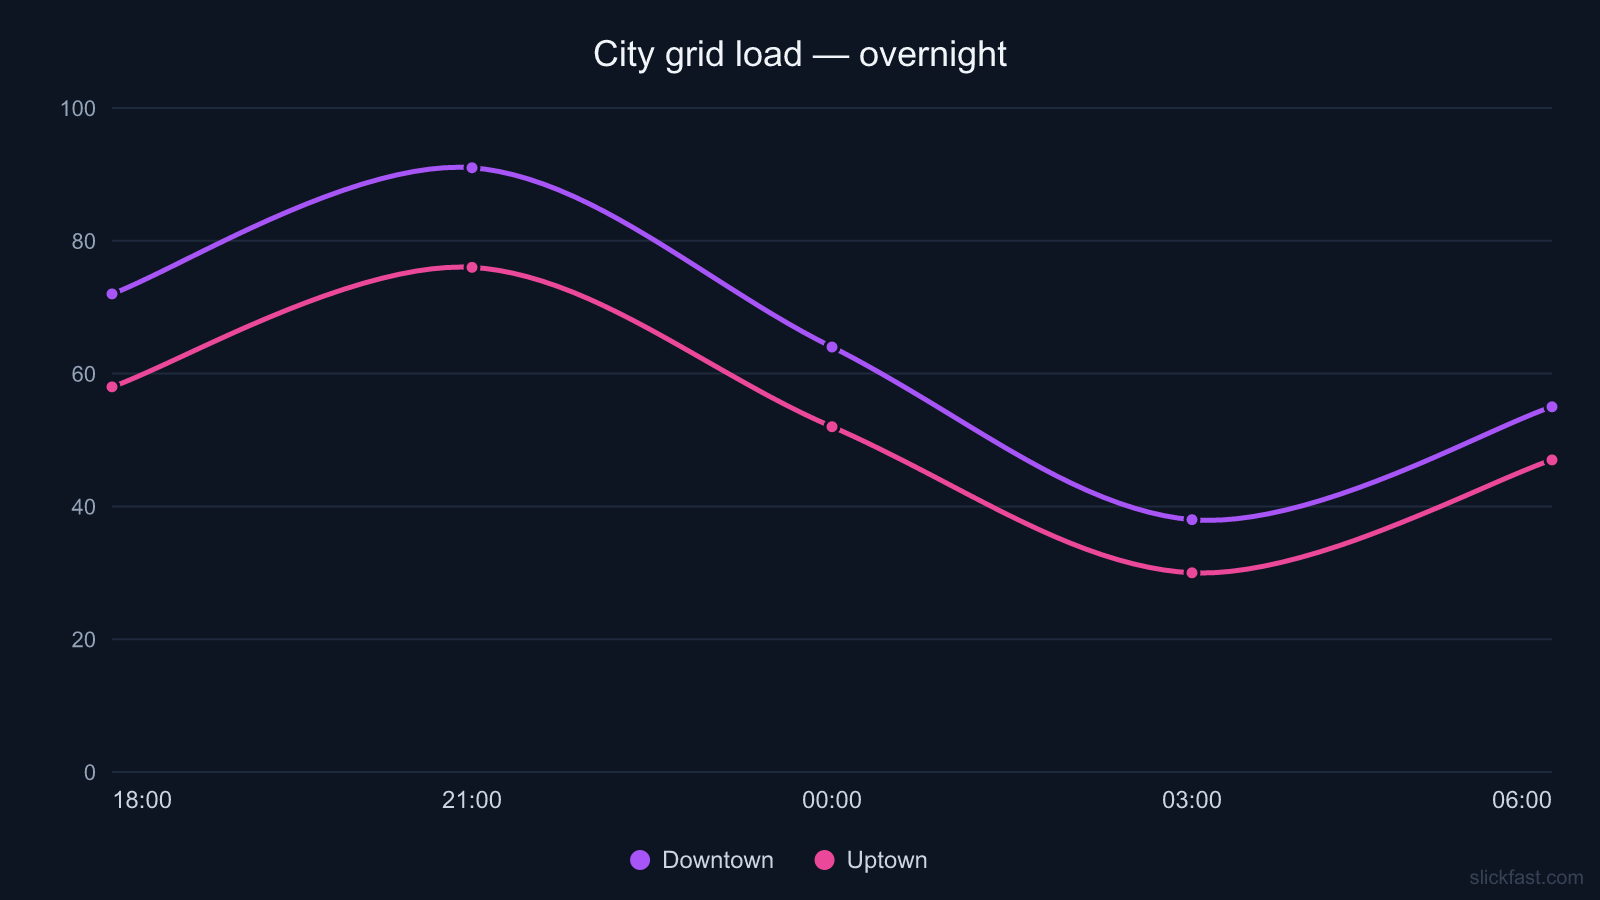
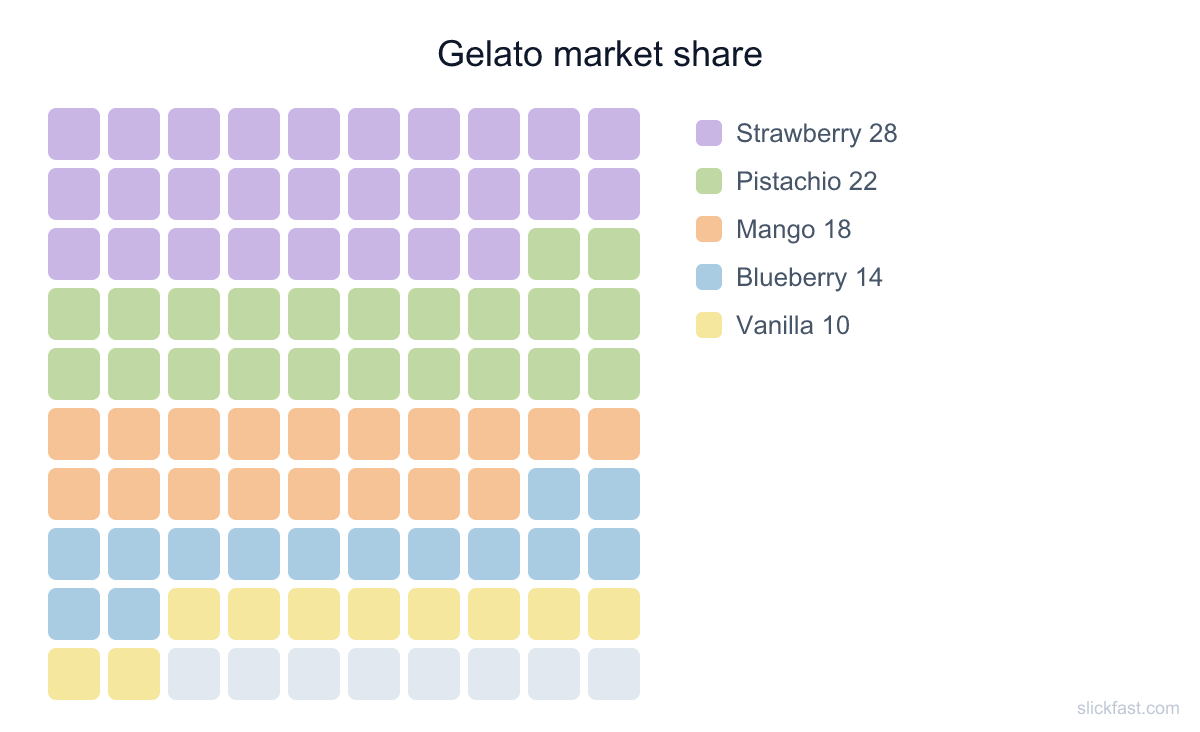
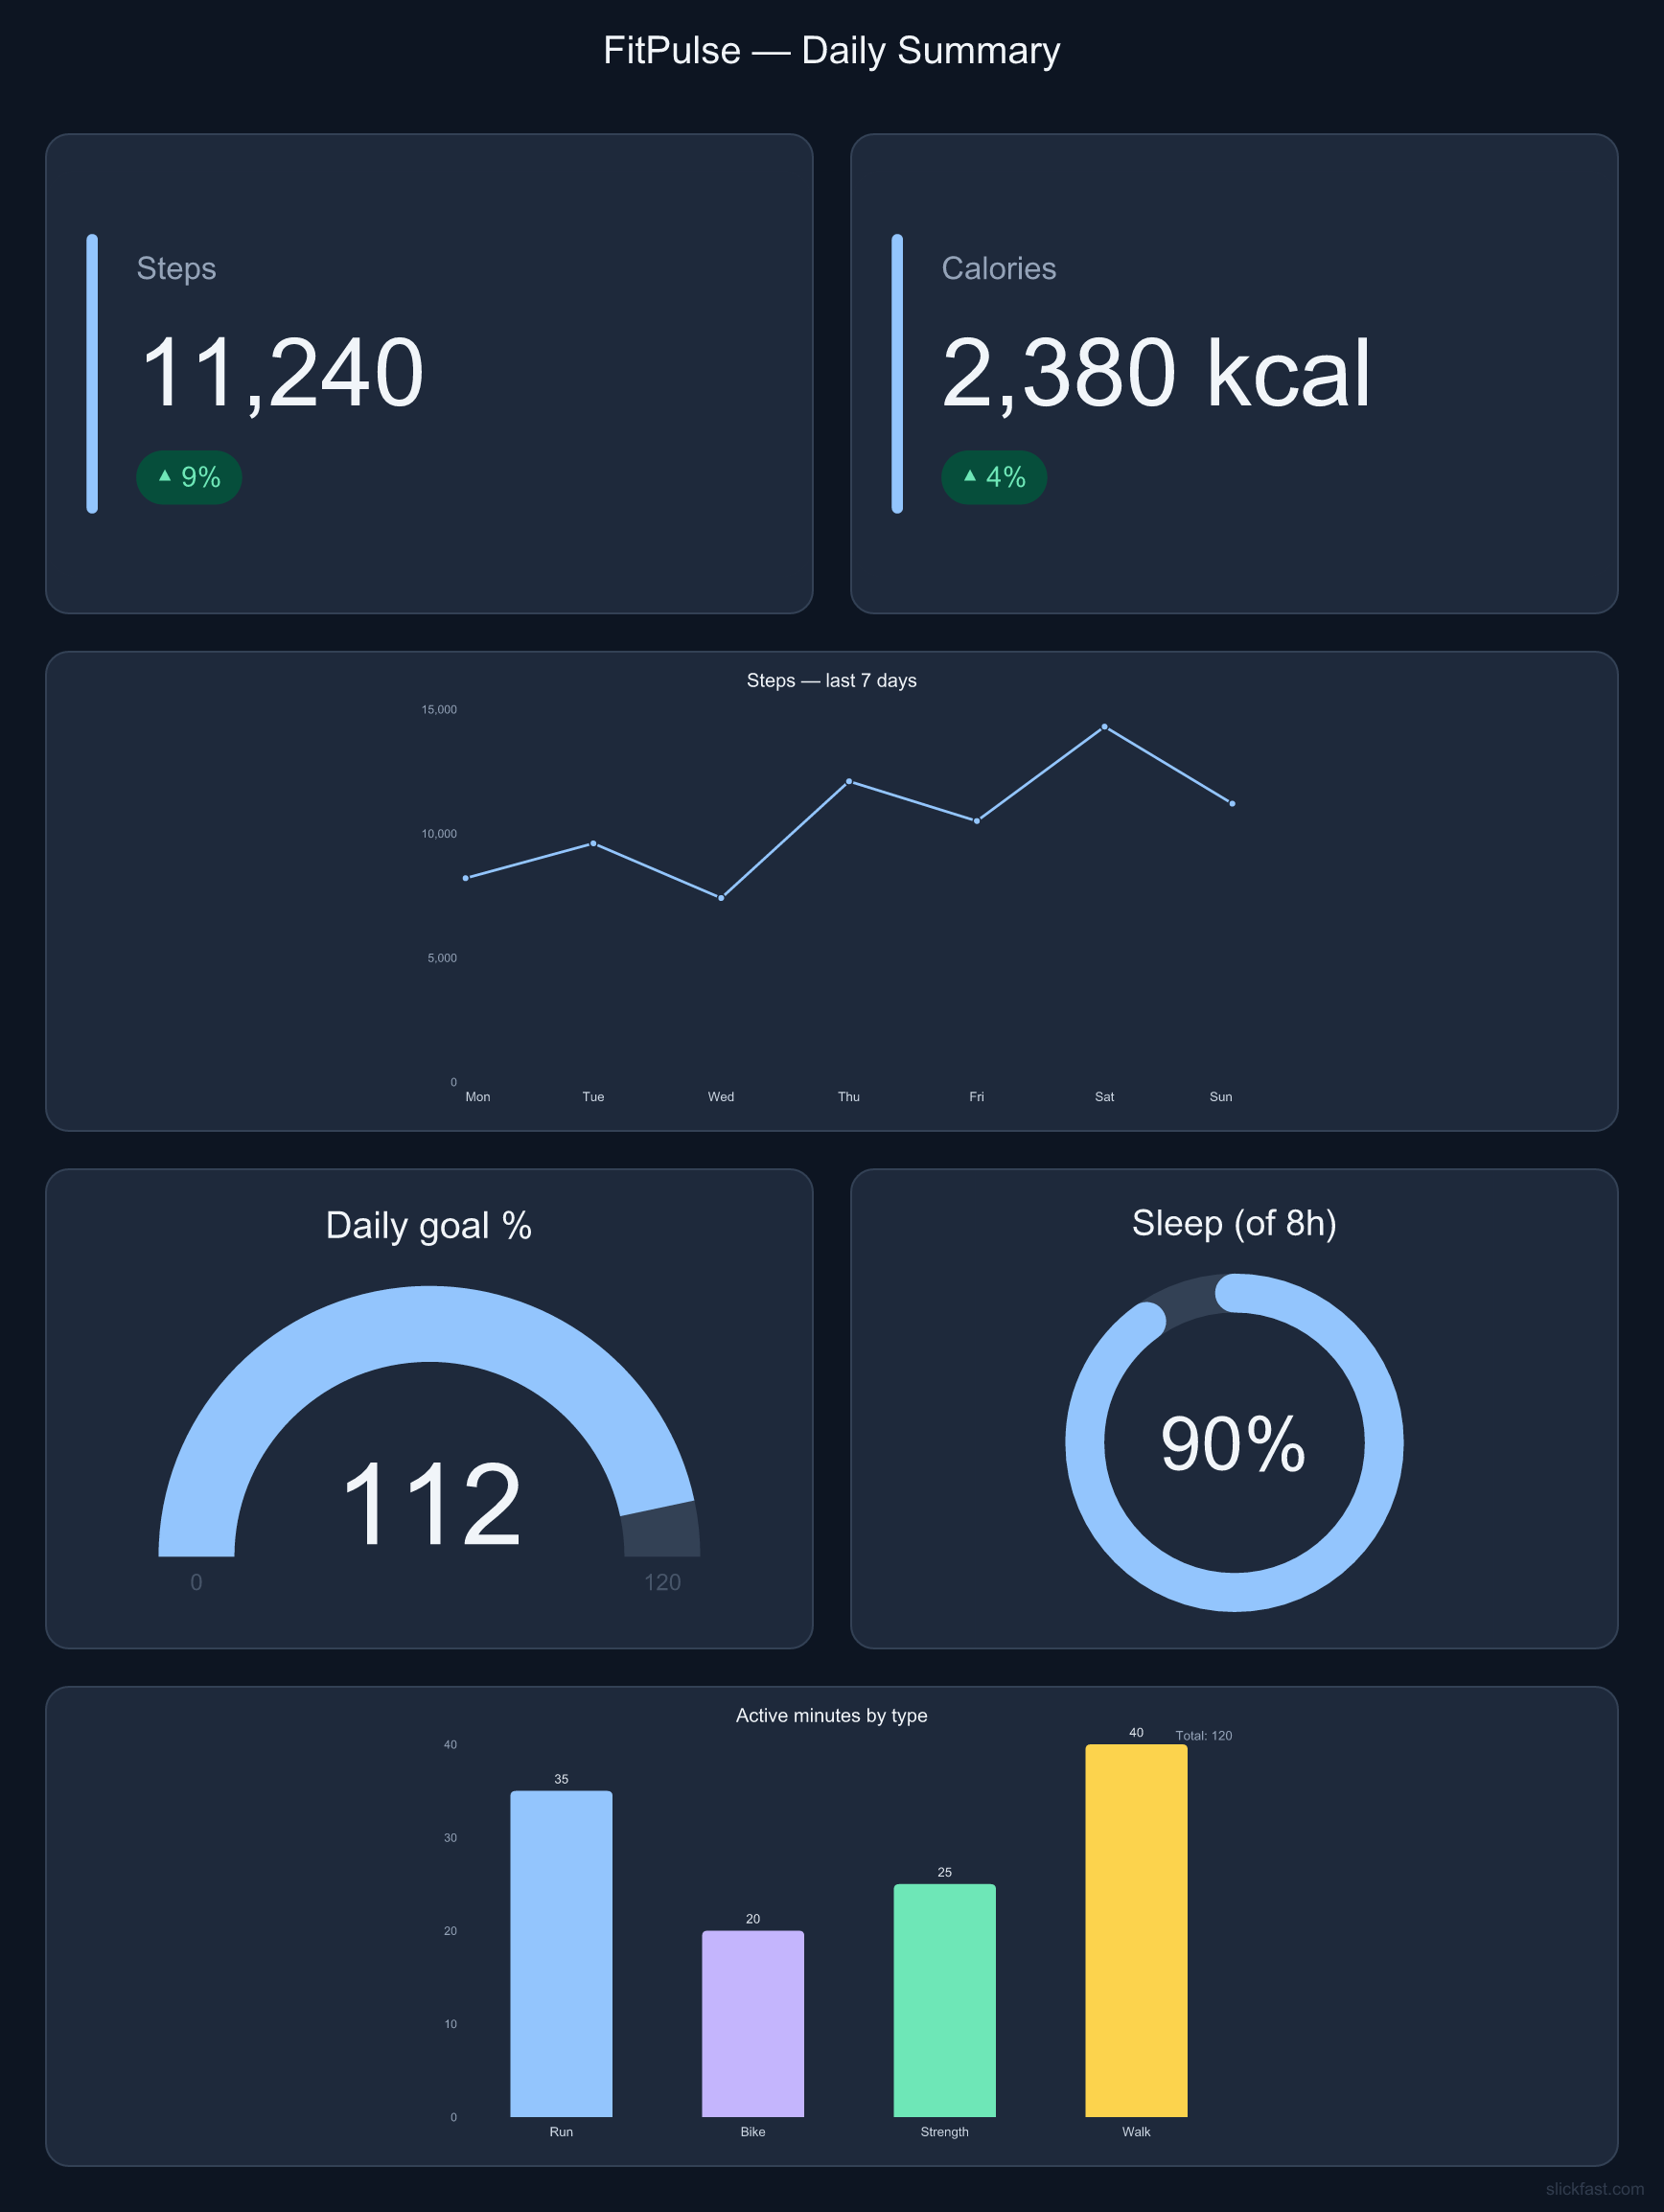
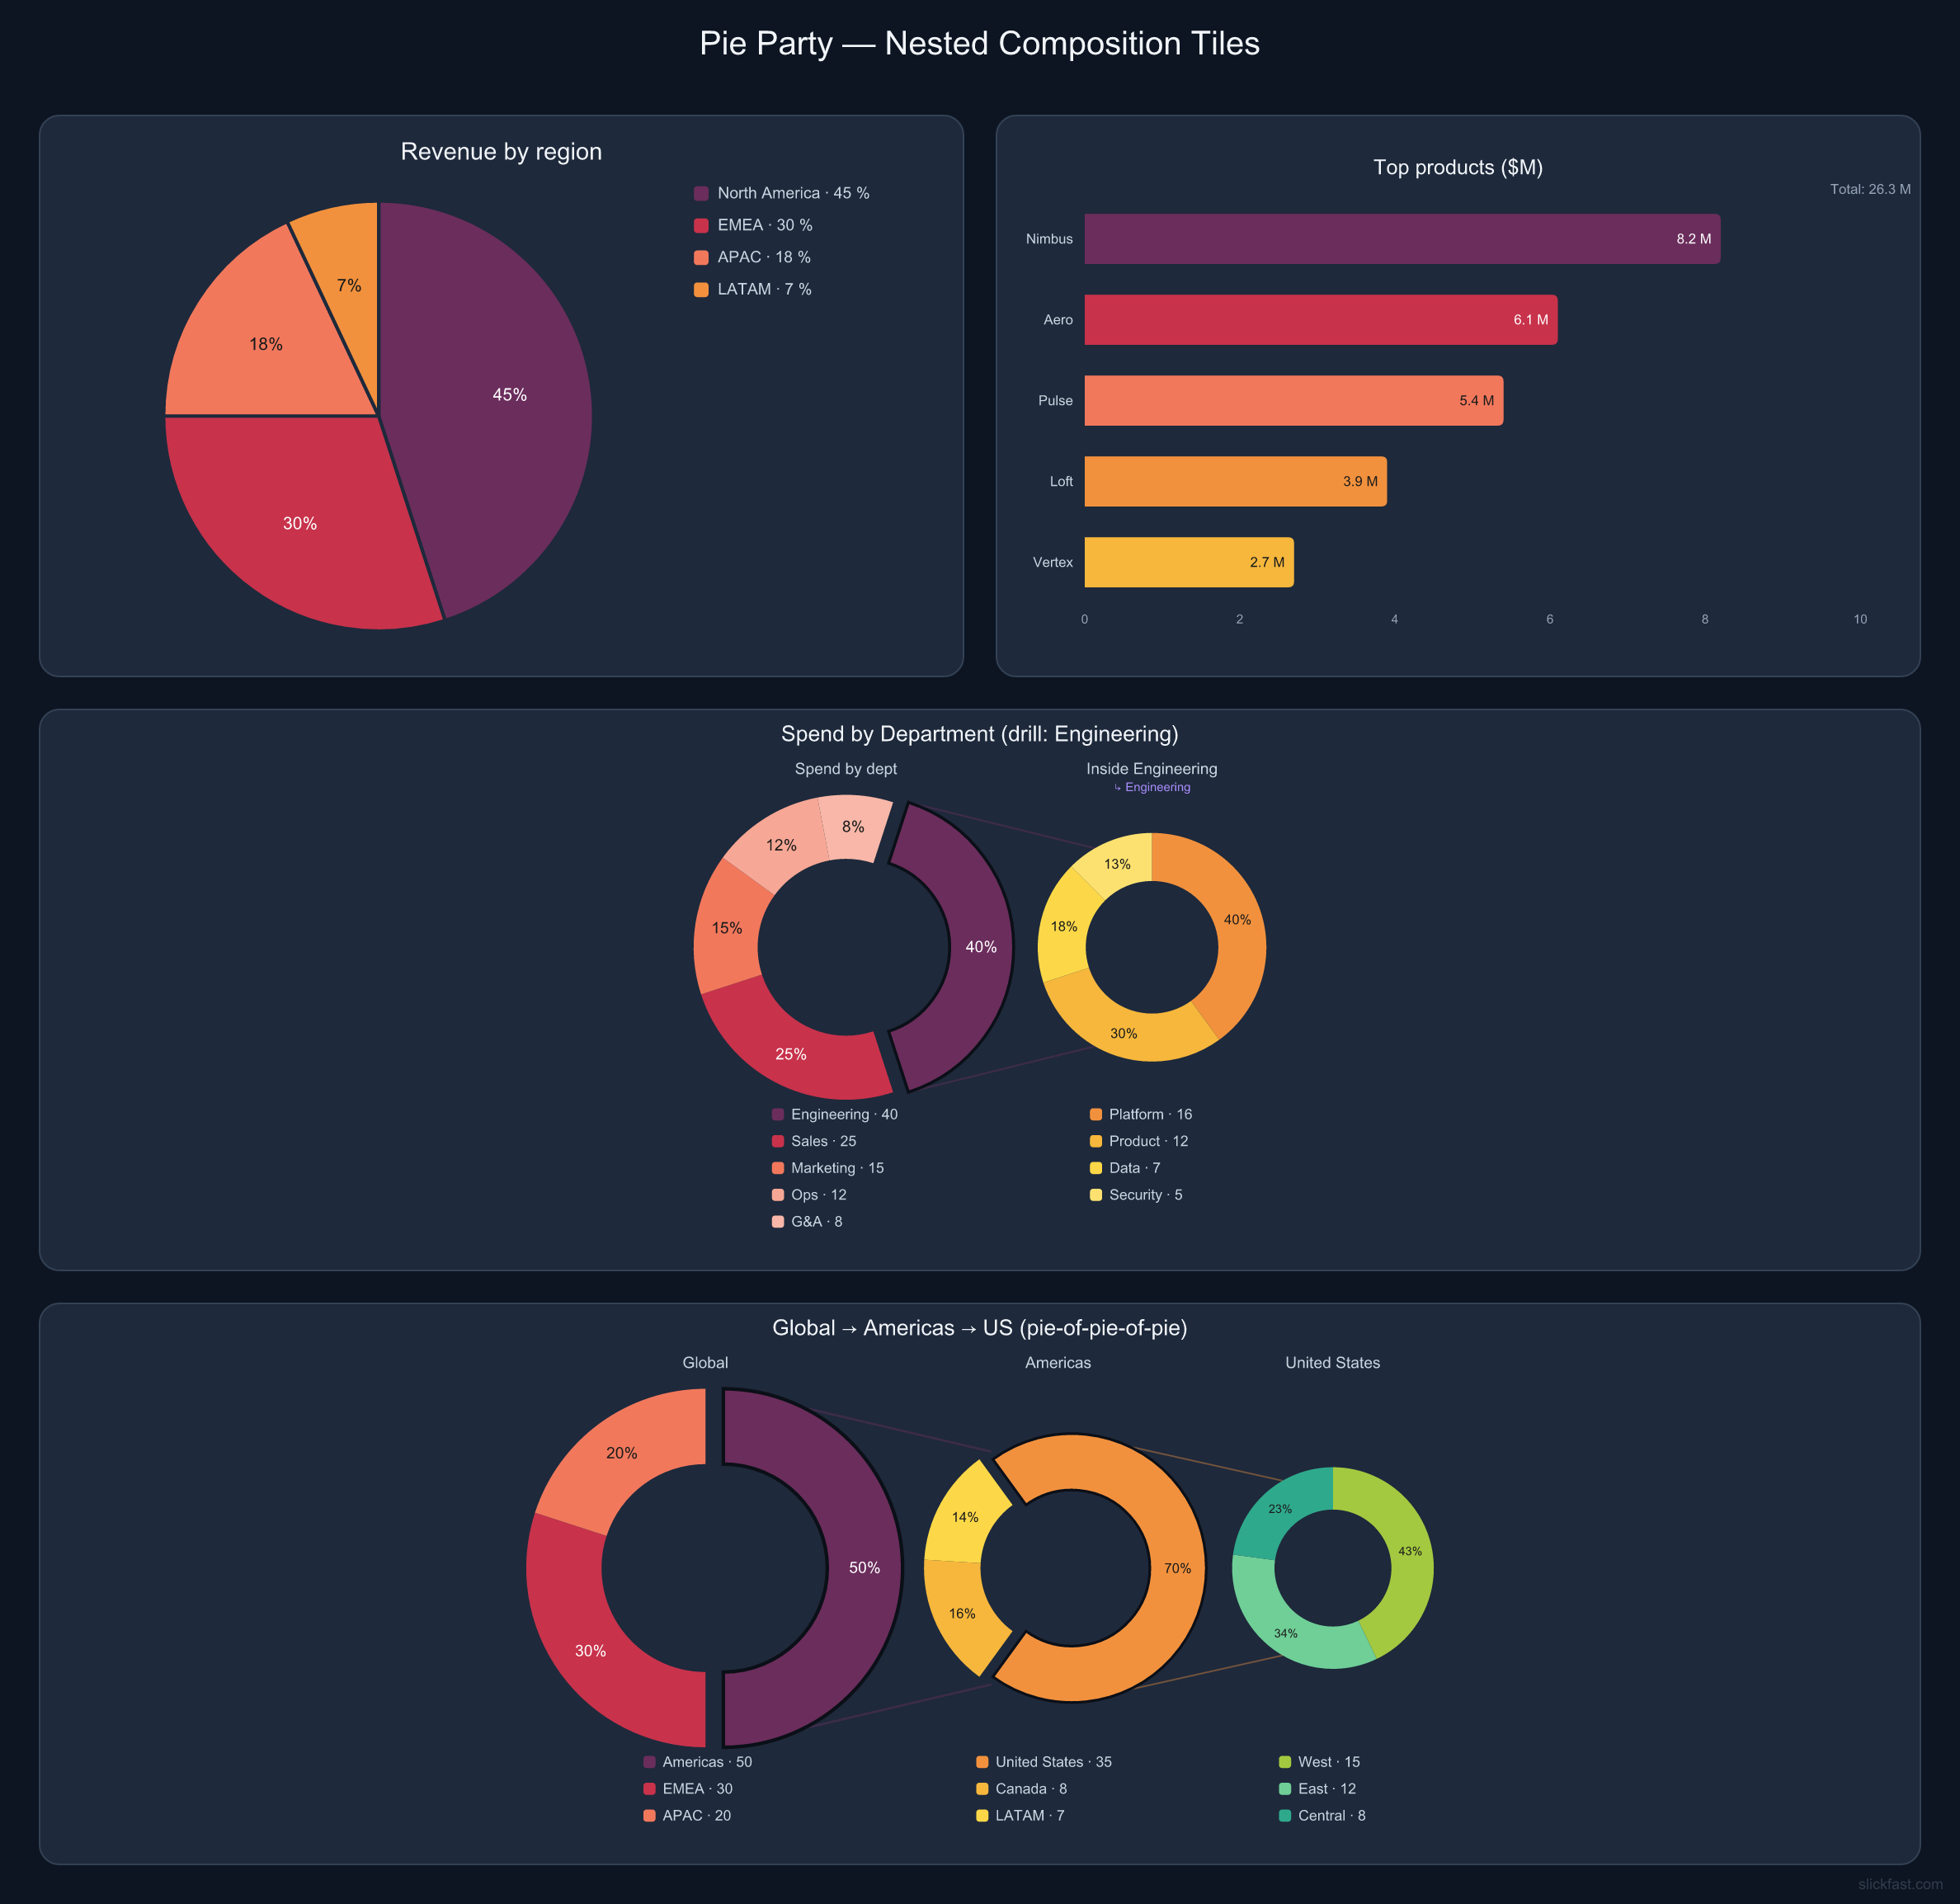
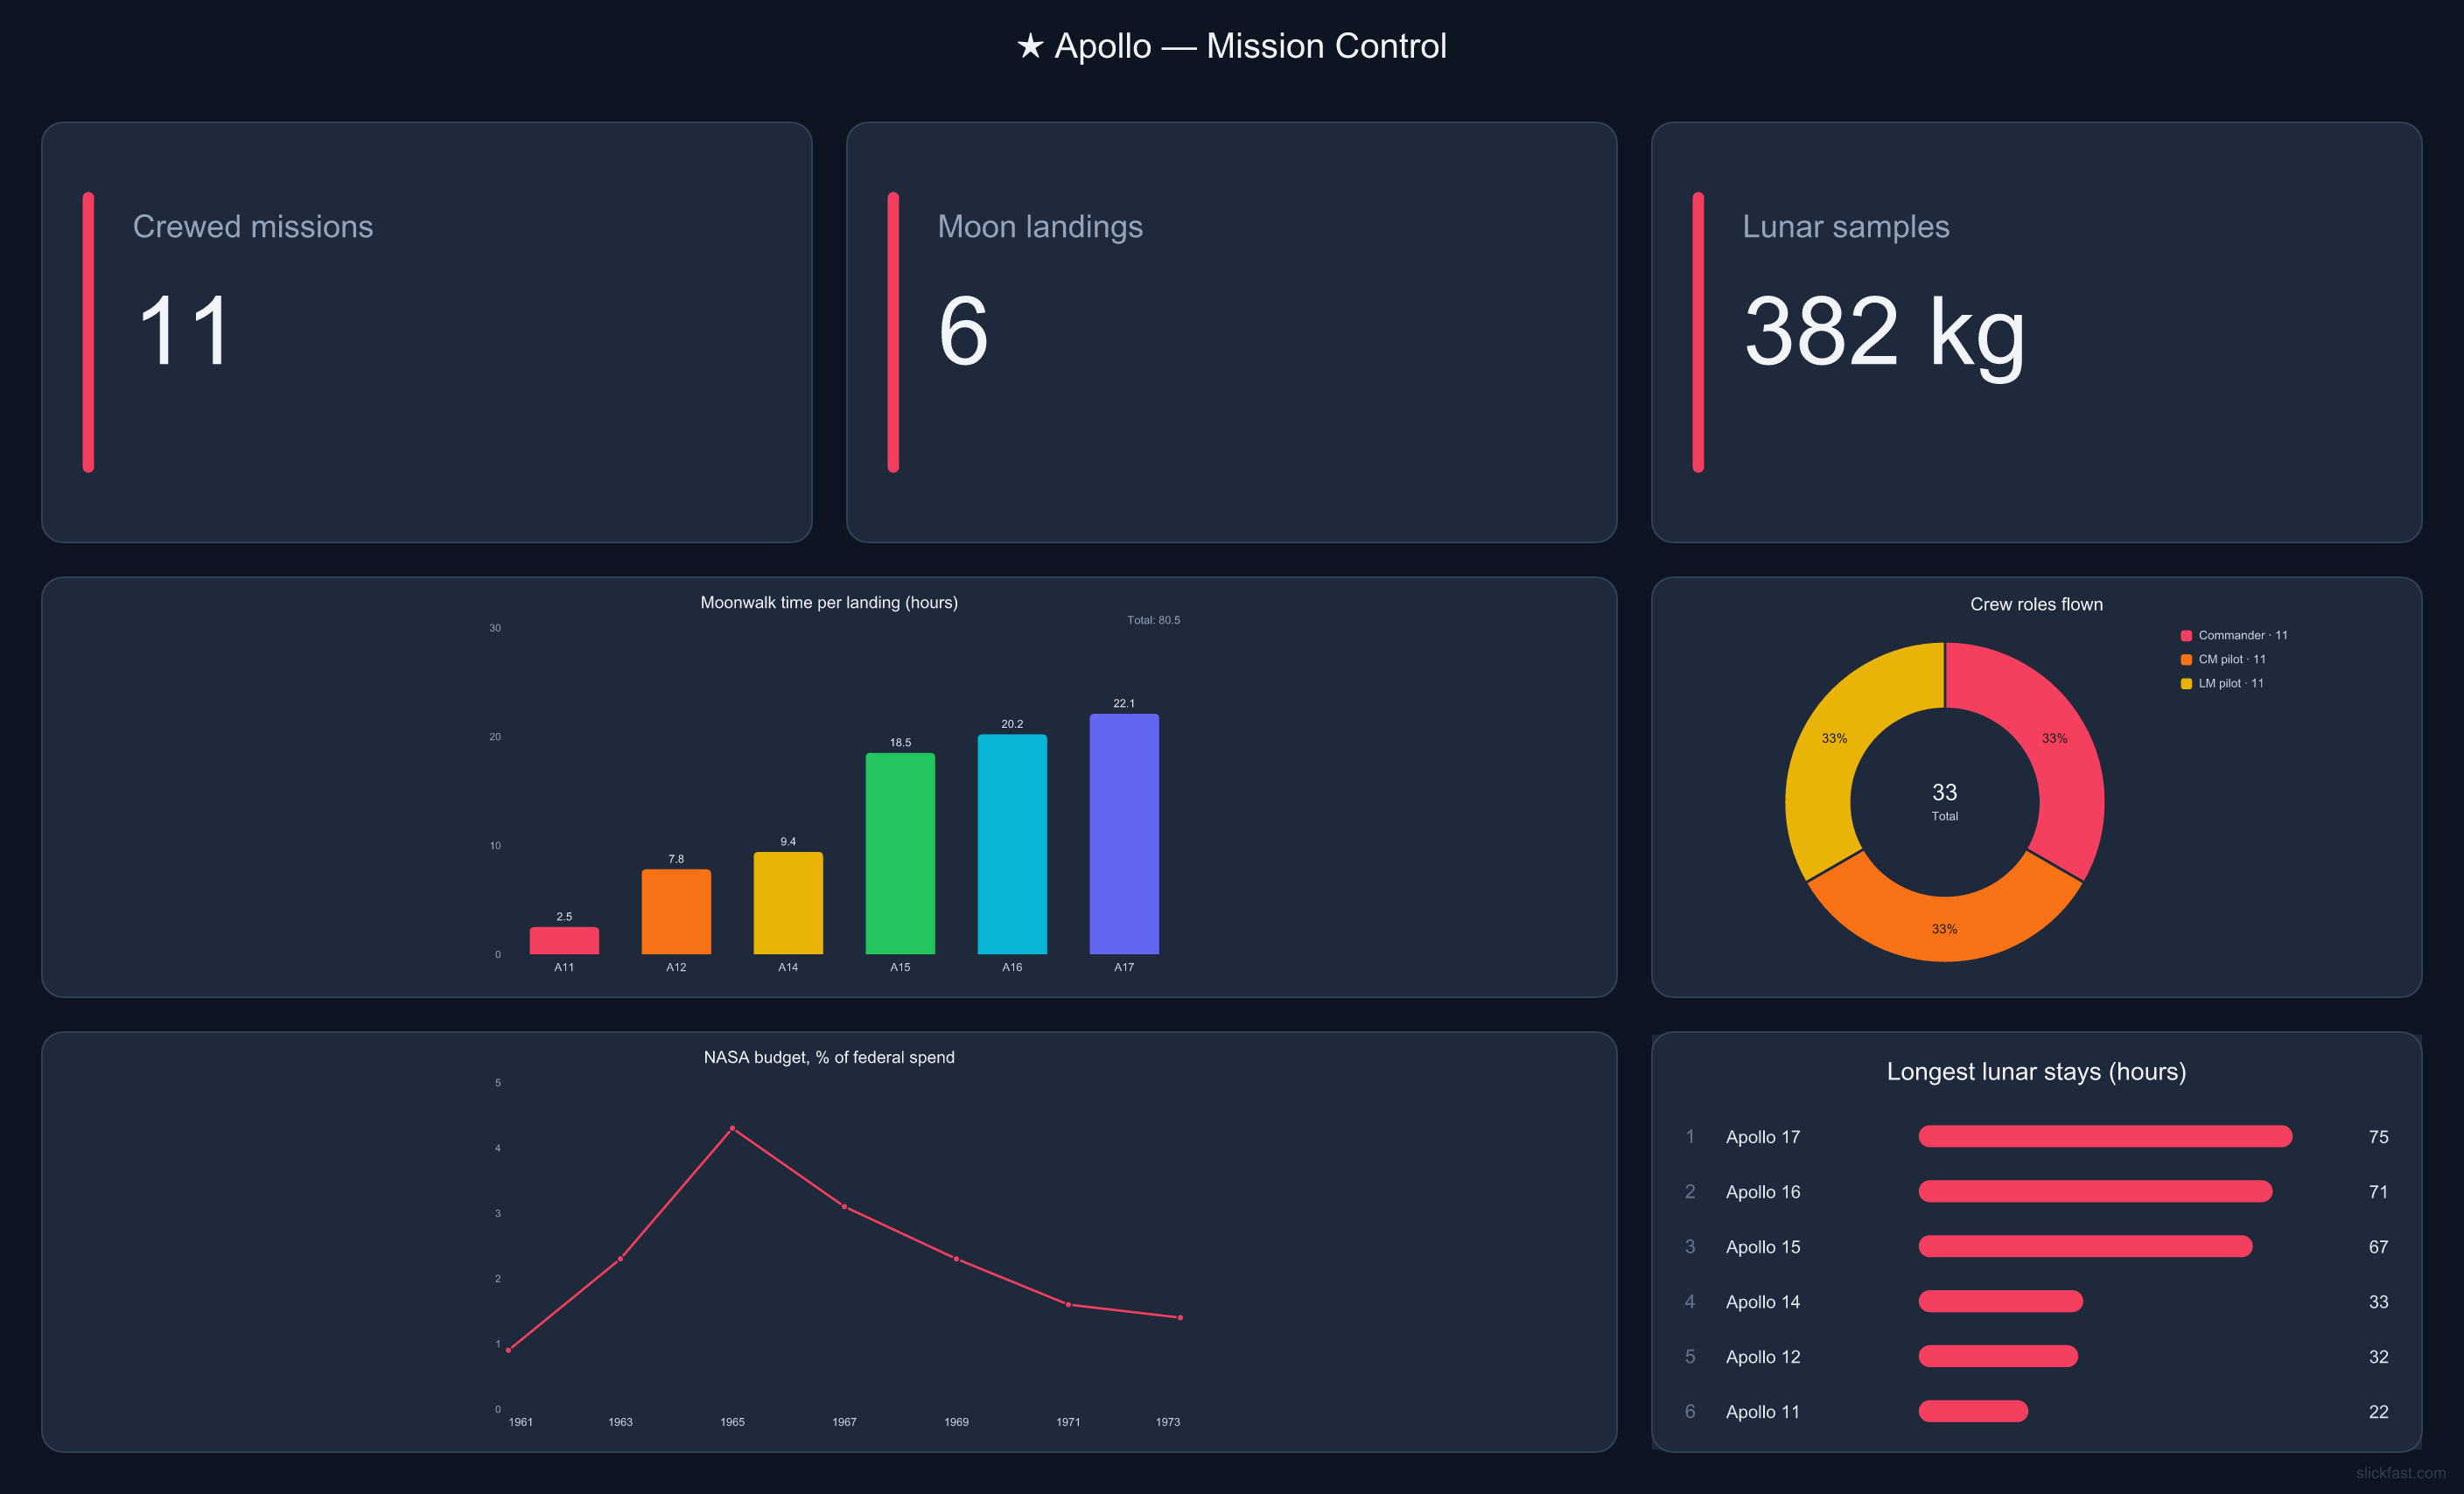
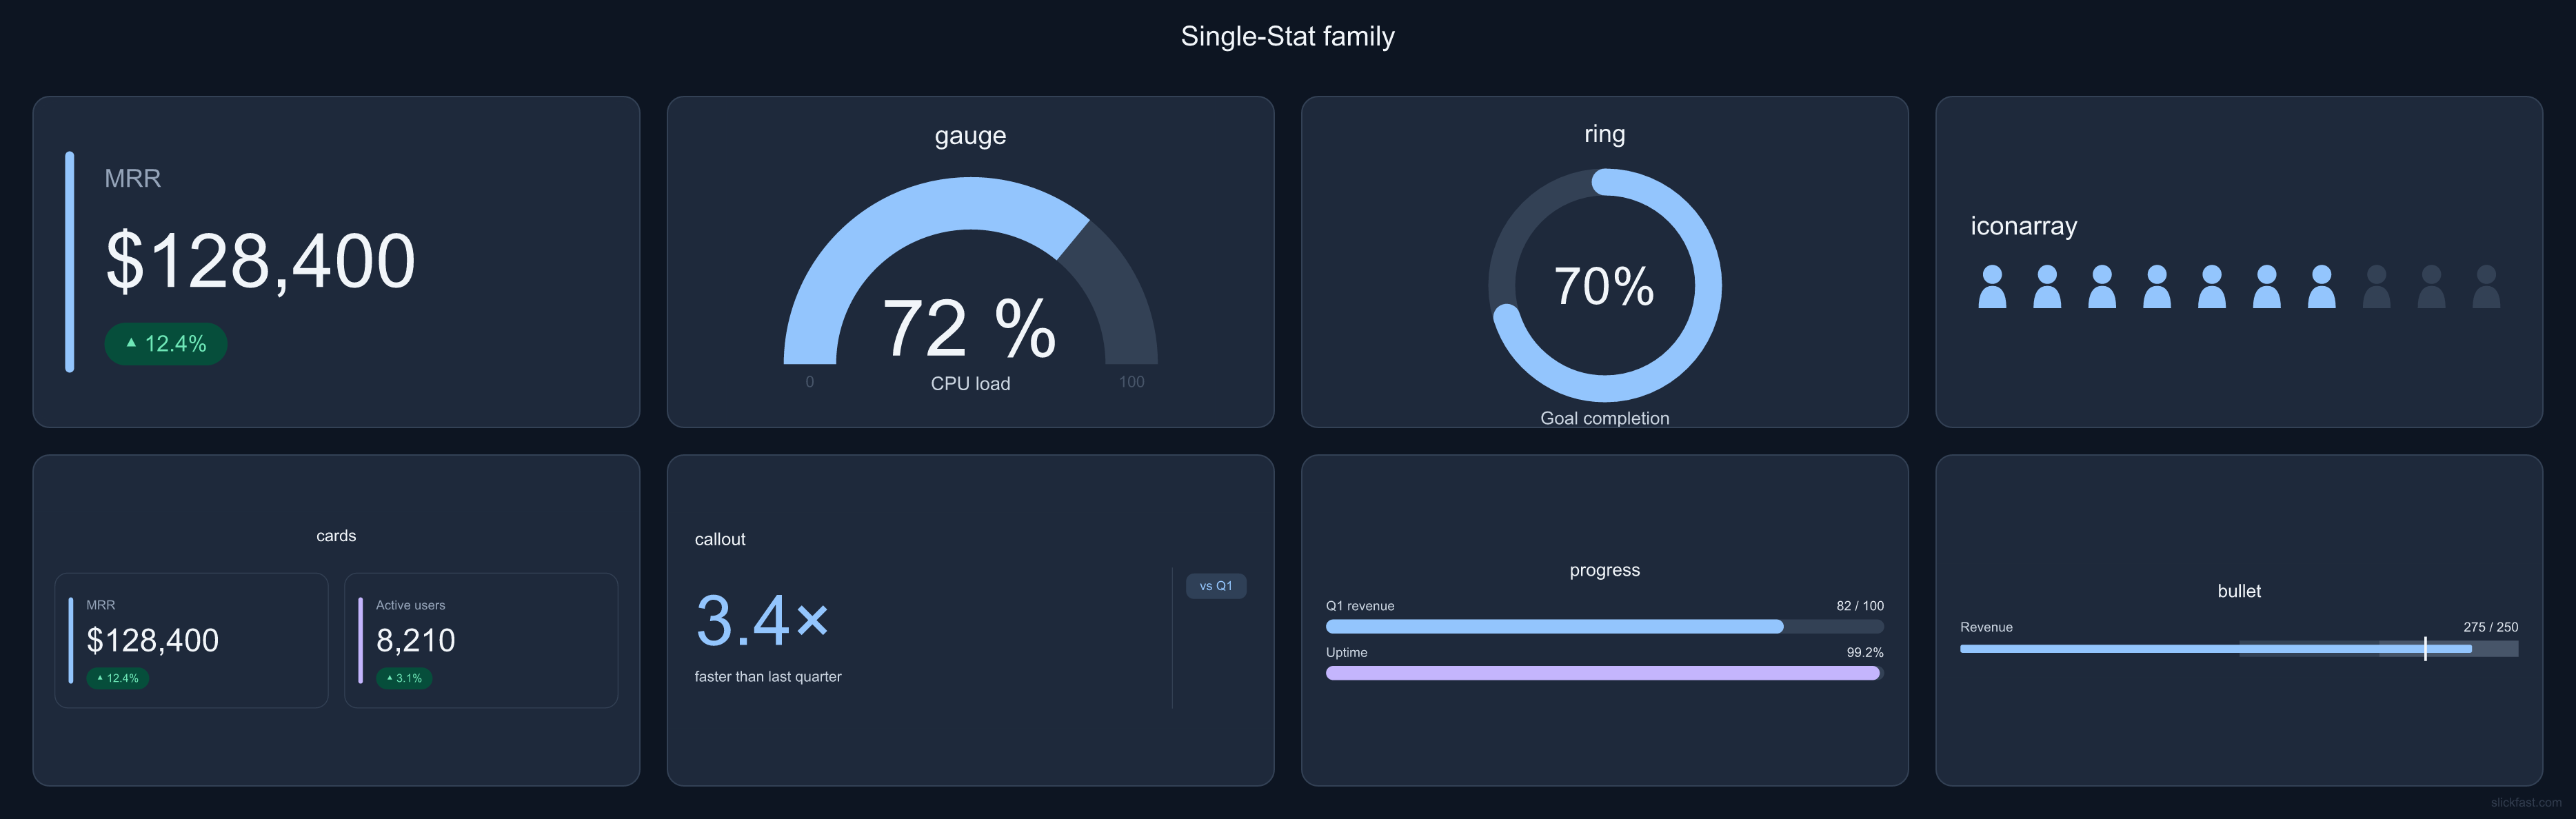
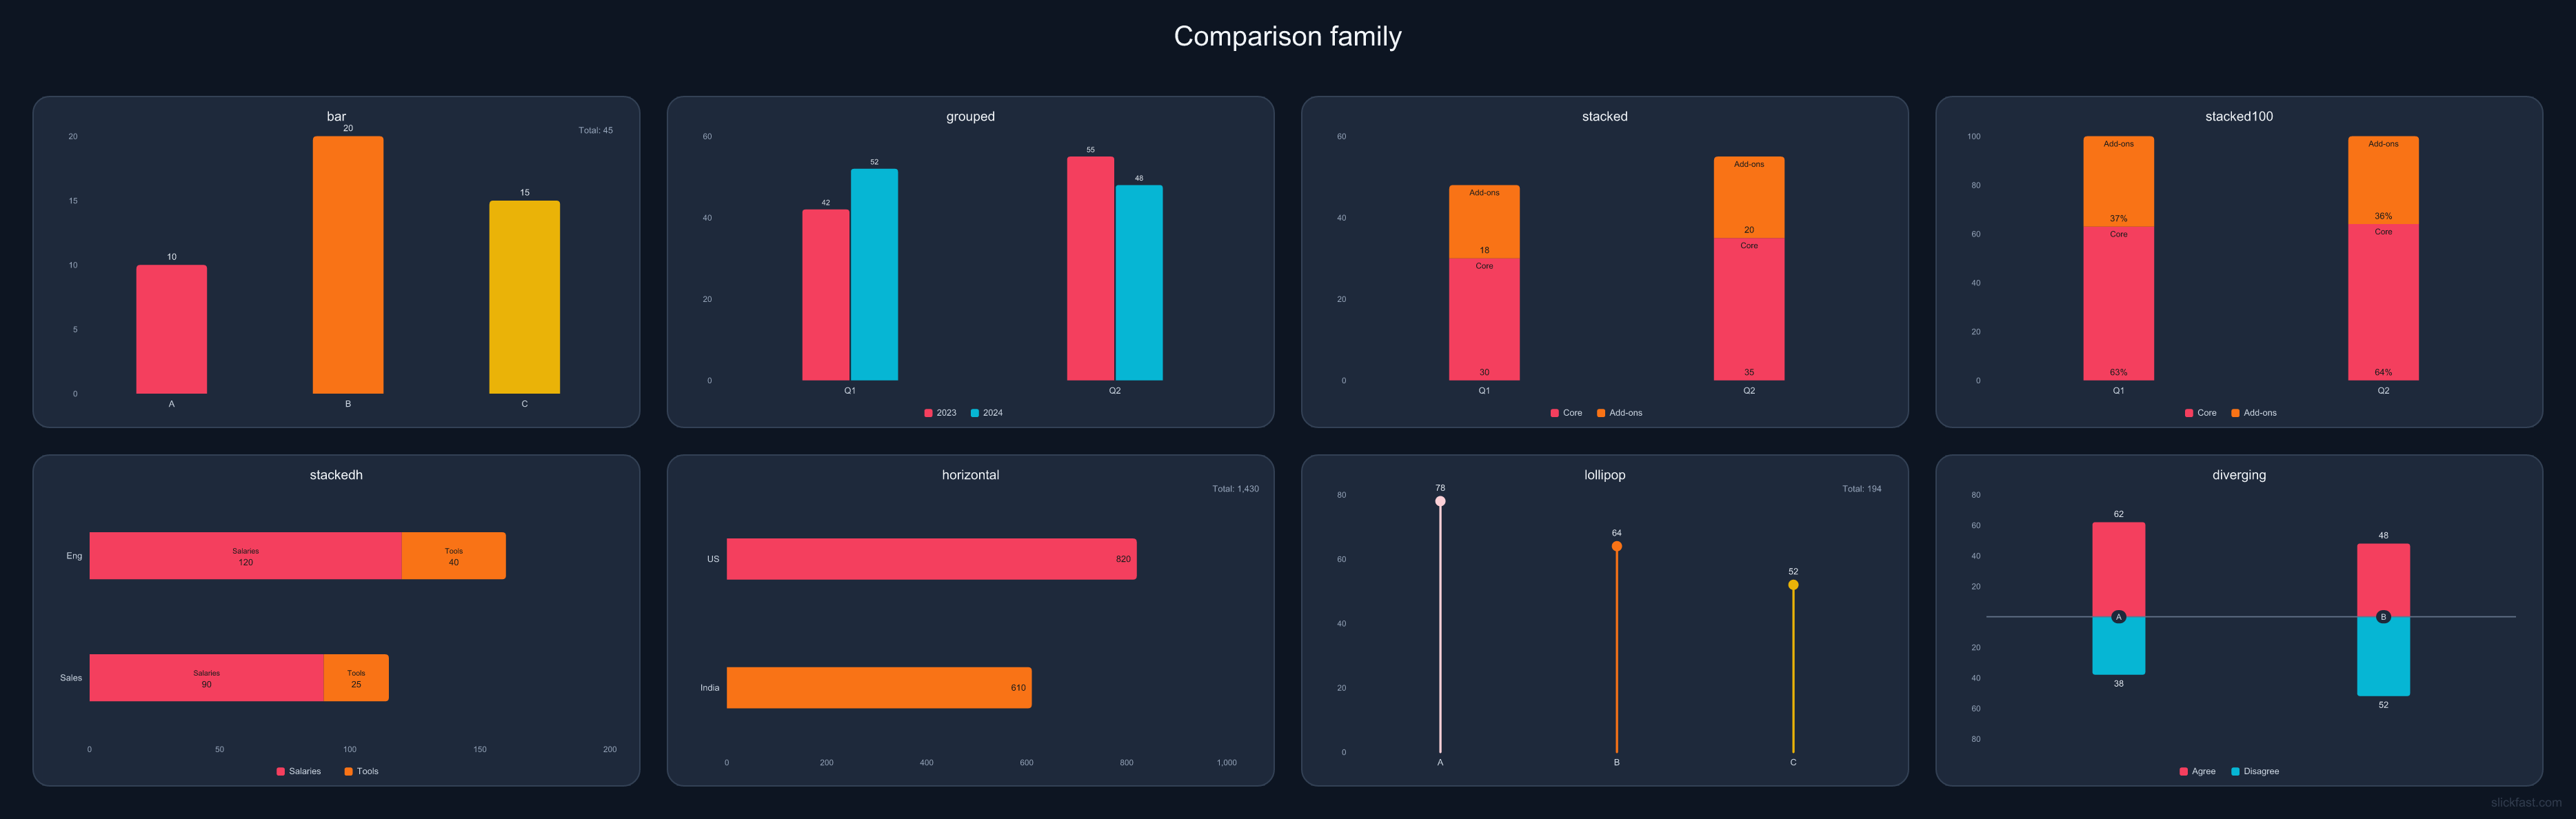
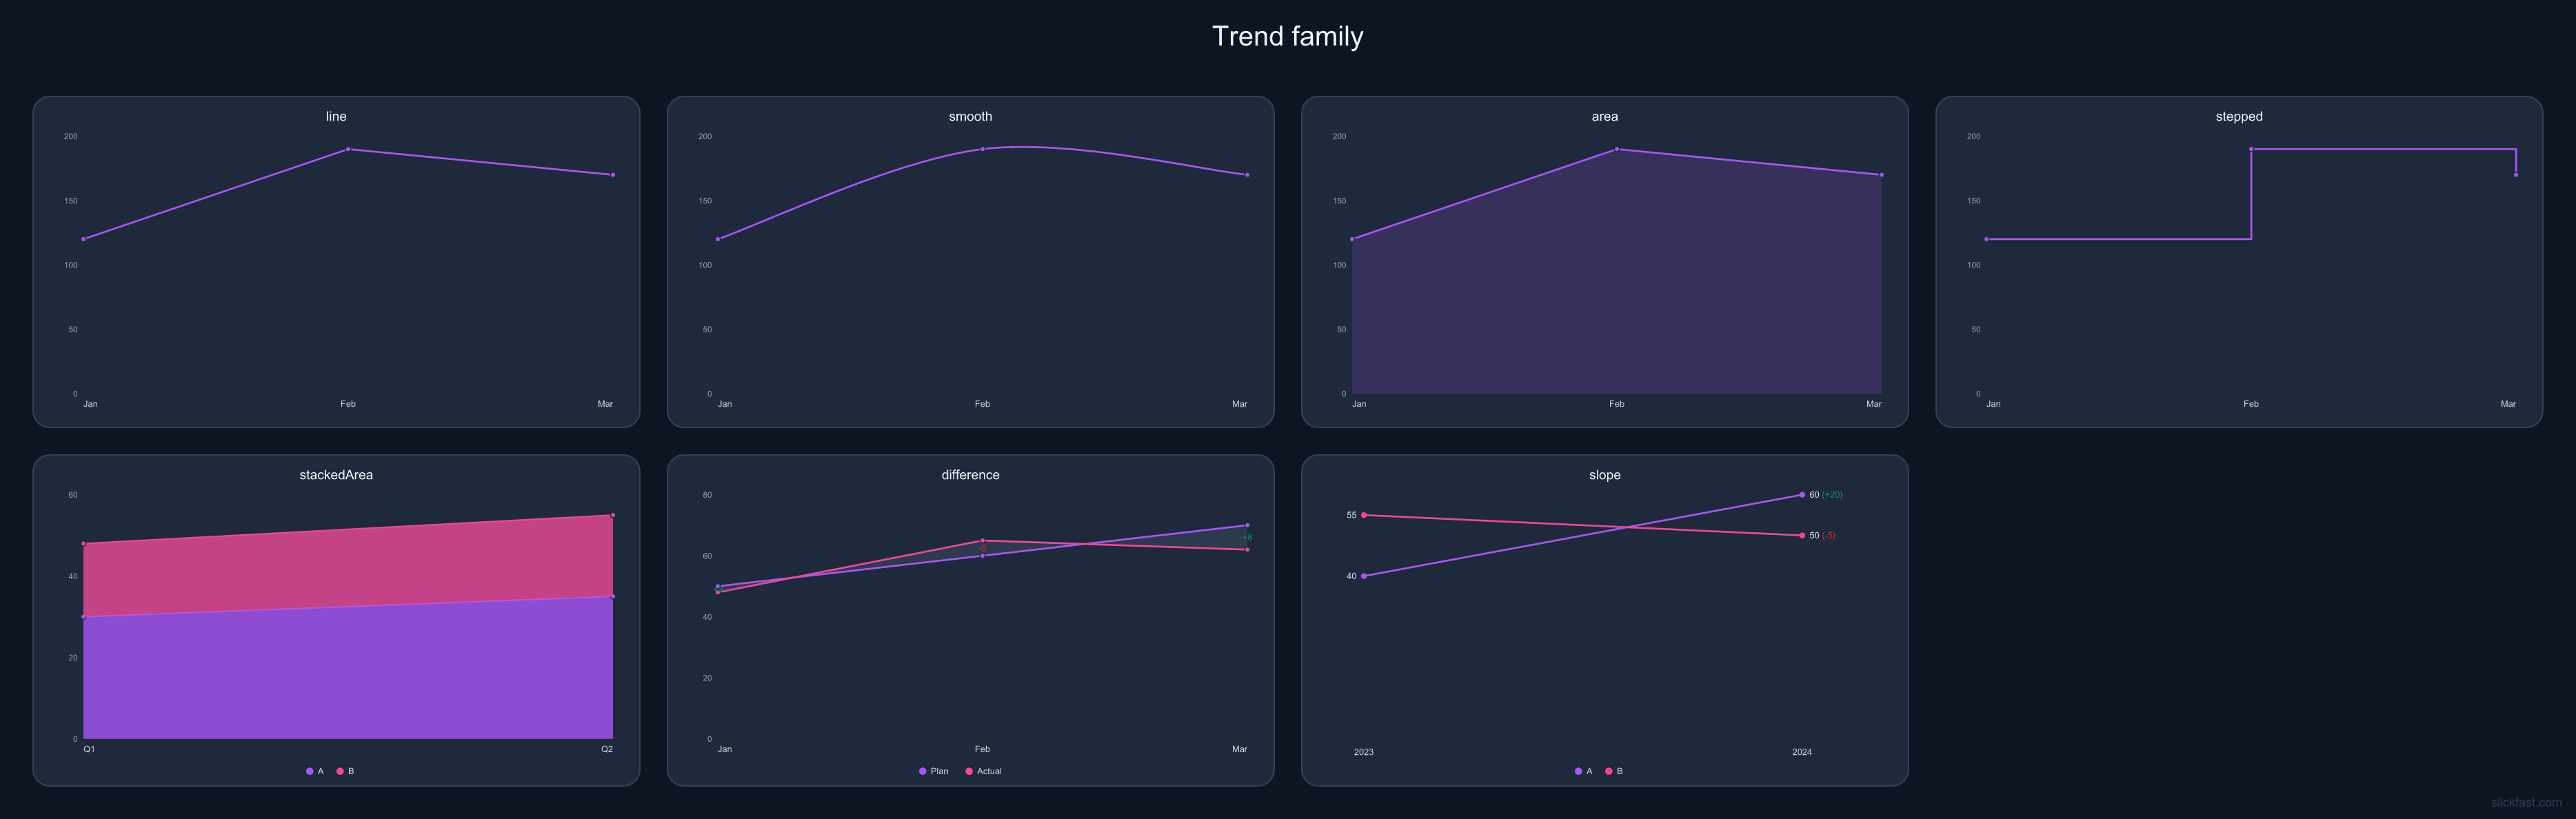
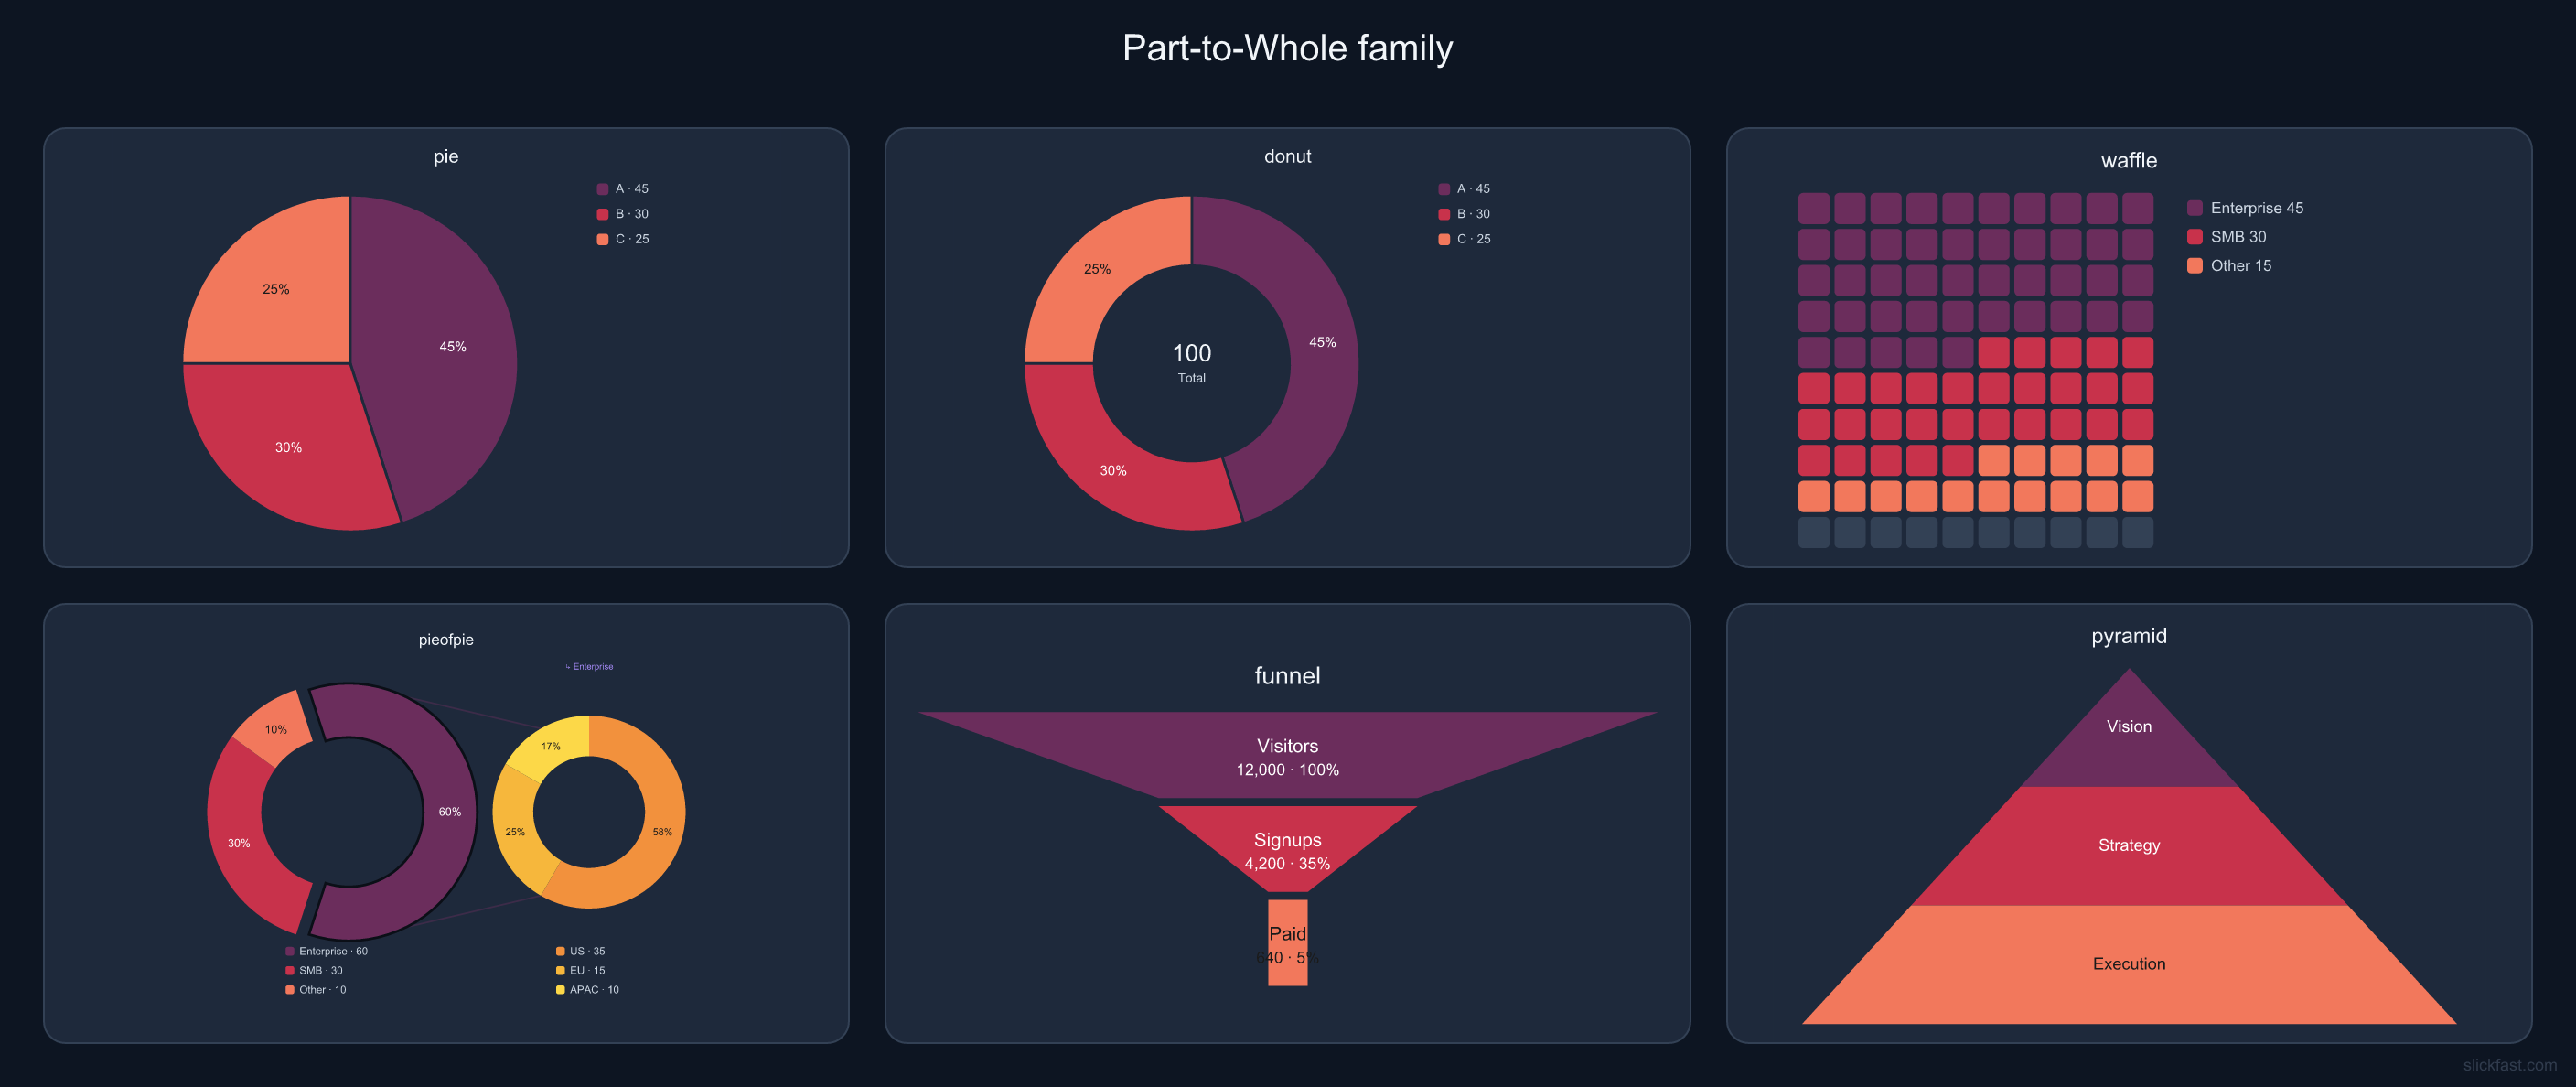
A live chart is a permanent image URL whose numbers update on their own. Create it once, embed it anywhere an image works — README, dashboard, email — then push new data whenever it changes. Every copy, everywhere, updates. SVG median in the public bench is about 15 microseconds; that is the engine clock, not the network.
The whole trick, in three lines:
1 · Create — one call stores your chart and returns its permanent URL.
2 · Push — your script (or your AI agent) sends fresh numbers whenever they change.
3 · Done — every embed of that URL shows the latest data within seconds of a
push. Viewers need no key, and views are never metered — unlimited audience on every plan.
The agent is the sensor. Tell an agent "watch our signups and keep the chart current." If an agent can see it, your chart can show it, live.

Dashboards are dynamic tiling. Every board on this page is one JSON spec — a list of tiles, each tile a chart, each chart a span.
A render is one chart, one dashboard, or one Page draw. CDN-cached — one render can serve any number of views.
The local MCP runs on your machine — free forever, unlimited renders, 47 gallery types plus eight scientific types, no account, no card, nothing sent anywhere. The plans below are for the hosted API and our MCP server: public chart URLs, live charts, and Pages. If you never need a public URL, you never need a plan.
What counts as a render? Only drawing a new chart or Page. Each unique draw counts once — after that, every view of its URL is served from cache, free and uncounted. A million people can look at the same chart and your meter ticks once. You pay when we draw — not every time someone looks. Change the data and that's a new render; a chart may occasionally re-render (first views from a new region, or after long inactivity) — a few extra ticks, not per-view billing.
Live charts: creating one or pushing new data counts as a render — but views are free and unlimited on every tier. Your audience is never metered. Quotas reset monthly; if you hit yours, creates and pushes pause but your embeds keep serving the last data. Live charts belong to your account — rotate keys freely, your charts follow you.
Unlisted ≠ private. Live charts, Pages, and
share URLs use hard-to-guess links — anyone with the link can view
them, and Pages expose a .json twin. Don’t host secrets. Details:
Privacy.
Need more than 50k renders? Write to feedback@slickfast.com. Want the engine inside your own product? See commercial licensing.
Local renders on your machine via npx — no clone, no build, nothing leaves the machine. Hosted MCP is the same tools over a URL. The API turns a spec into a public image URL.
{
  "mcpServers": {
    "slickfast": {
      "command": "npx",
      "args": ["-y", "@slickfast/mcp"]
    }
  }
}
npx -y @slickfast/mcp
— no clone, no global install. Charts on the machine need no key.https://mcp.slickfast.com/mcp
SPEC='{"type":"bar","data":{"labels":["Q1","Q2","Q3"],
       "series":[{"values":[12,19,8]}]}}'

curl "https://api.slickfast.com/chart.png?spec=$(jq -rn --arg s "$SPEC" '$s|@uri')" \
  -H "Authorization: Bearer sf_your_key" \
  --output chart.png
sf_. Bearer,
X-API-Key, or ?key=.
/chart.svg returns vector.


Settings → Developer → Edit Config, or edit the file directly:
macOS ~/Library/Application Support/Claude/claude_desktop_config.json,
Windows %APPDATA%\Claude\claude_desktop_config.json. Restart Claude after saving.Settings → MCP → Add new server, or drop the same JSON in ~/.cursor/mcp.json.claude mcp add slickfast -- npx -y @slickfast/mcp.mcp.slickfast.com.Once it's connected:
"Call get_started, then show me the gallery, then render a dashboard with an MRR tile, a funnel, and a heatmap."
Smaller first step: "render a bar chart of last quarter's revenue", or "what's new — call news".
node -v; install from nodejs.org if it's missing.npx downloads the package once, then every run is instant.SlickFast is open source under AGPL-3.0. Using it with your agent is free — Local MCP, on your machine, no key. The charts you make are yours. Want SlickFast inside a closed commercial product? Per-app commercial licenses start at $99/year — no license keys, no hoops.
A pagespec is a whole public document. Twin at .json. Fingerprint on the page. News is one ↑
One chart URL, always current — embed it anywhere an image loads. It's live ↑
No install: paste mcp.slickfast.com into claude.ai or your cloud builder.
Same tools as the local MCP, metered on the same free tier.
A chart in the inbox that's current at every open, not a stale screenshot — weekly-numbers emails, usage digests, newsletter data-viz.
Edit a spec in the browser and watch the chart re-render as you type.
The engine grows steadily — 47 gallery types plus eight scientific types today, and the tiling system keeps getting more expressive.
Start on a Page. Spec details live in the repo.